Analyzing HTTP Traffic for Endpoint Debugging
Struggling with API errors or performance issues? Understanding HTTP traffic is your go-to solution. It helps you track requests, pinpoint bugs, and improve performance. Here's what you need to know:
-
Why Analyze HTTP Traffic?
- Debug API errors in real-time.
- Spot performance bottlenecks.
- Identify issues in distributed systems.
-
Core HTTP Elements:
- Request: Methods (GET, POST), headers, body, and parameters.
- Response: Status codes (200 OK, 404 Not Found), headers, and timing data.
-
Tools for macOS Users:
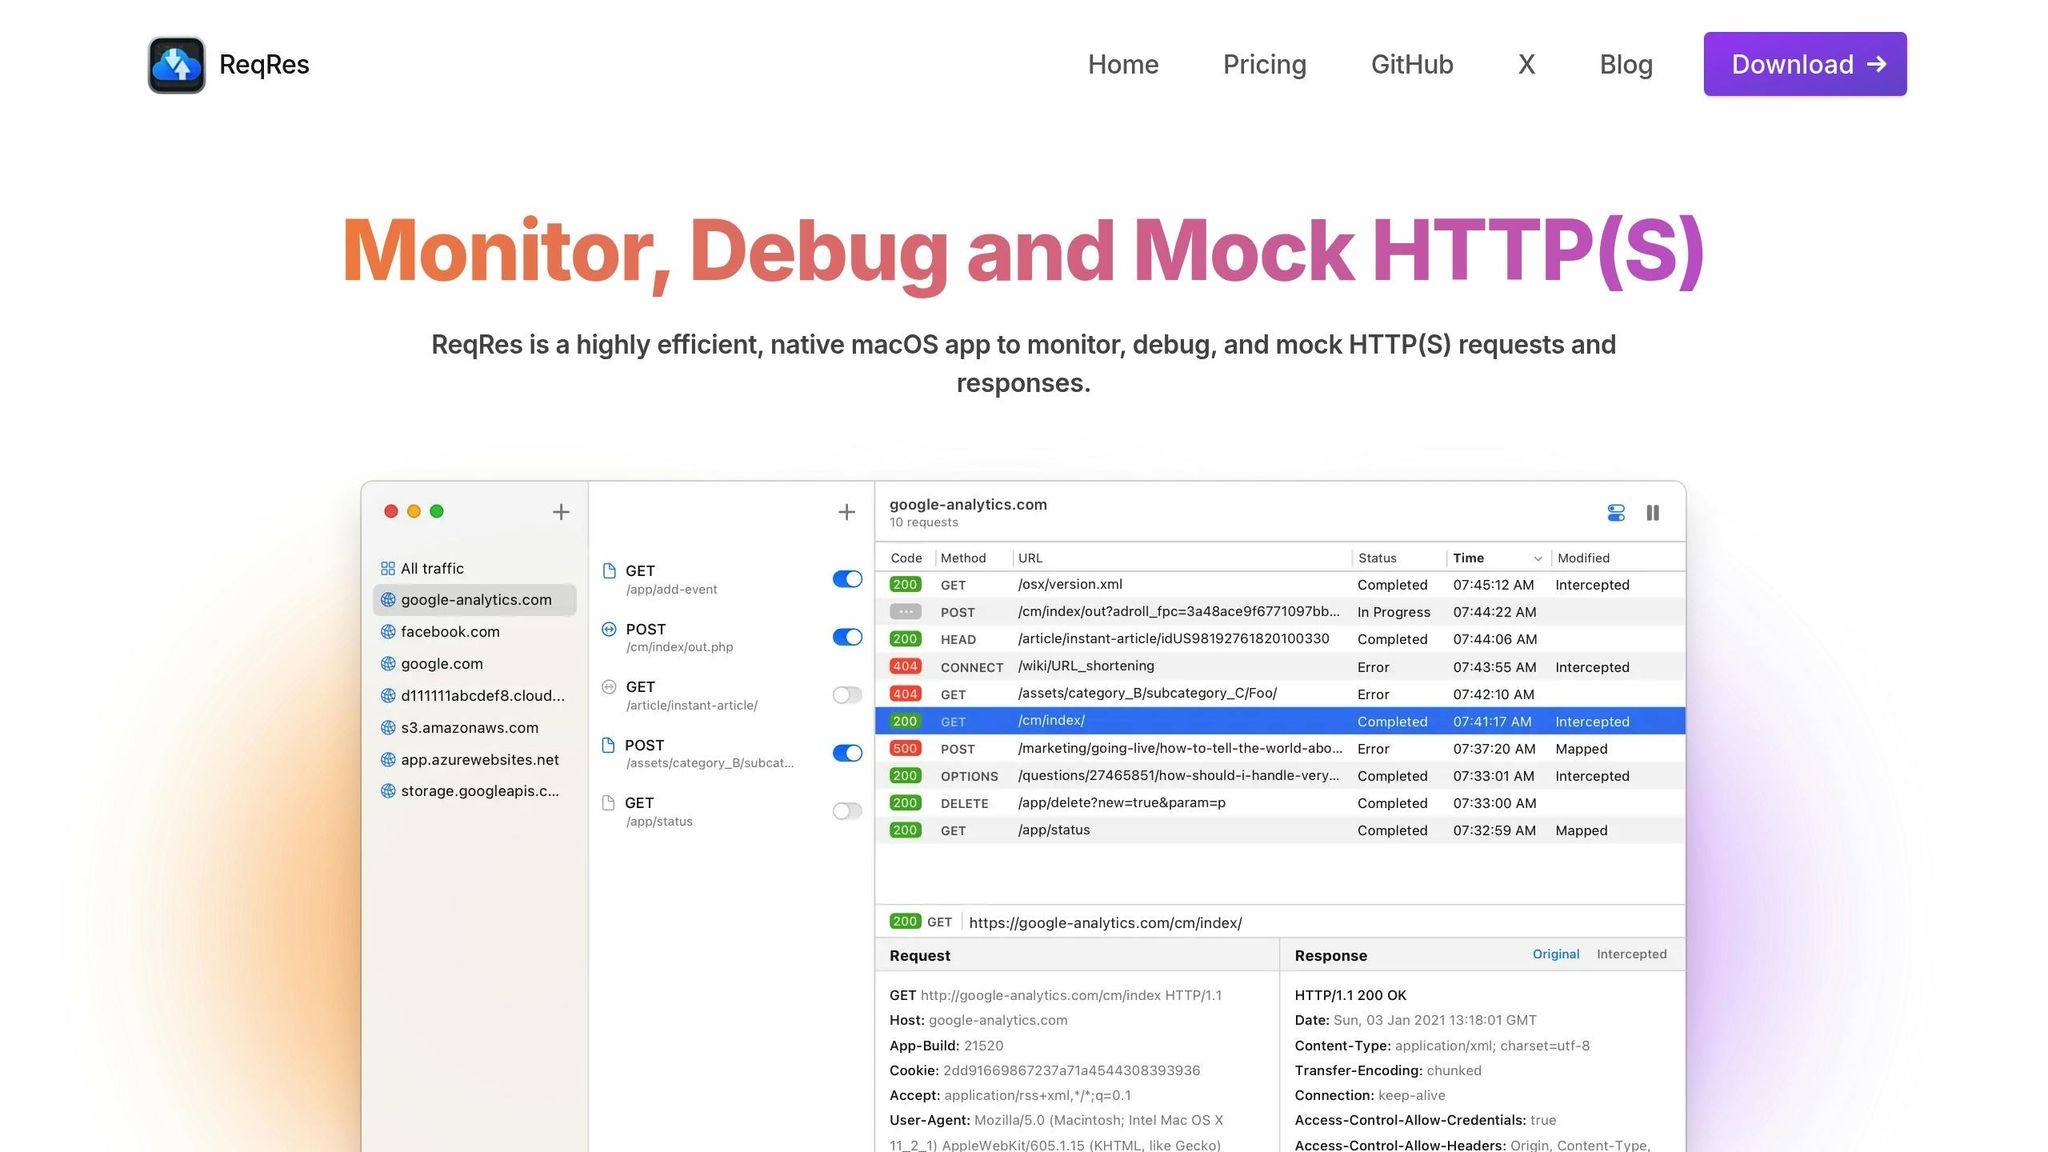
- ReqRes: A native macOS app to monitor, debug, and mock HTTP(S) traffic.
- Features include real-time traffic monitoring, filtering, and response simulation.
-
Practical Techniques:
- Use filters to focus on specific requests (e.g., by domain, method, or status code).
- Debug HTTPS by managing certificates in macOS Keychain.
- Simulate responses with local files to test edge cases.
-
Common Challenges:
- Fix HTTPS certificate errors.
- Resolve port conflicts.
- Address IPv6 connectivity issues.
-
Security Tips:
- Redact sensitive data during debugging.
- Secure credentials with macOS Keychain.
- Automate cleanup of debug logs.
Quick Comparison of HTTP Debugging Tools
| Tool | Platform | Key Features | Best For |
|---|---|---|---|
| ReqRes | macOS | Real-time monitoring, response mocking | Debugging APIs on macOS |
| Wireshark | Cross-Platform | Packet-level traffic inspection | Deep network analysis |
| Postman | Cross-Platform | API testing and collaboration | Manual API testing |
Start debugging smarter today. Tools like ReqRes make analyzing HTTP traffic simple and effective for macOS developers.
HTTP Traffic Debugging Basics
Getting a handle on HTTP traffic is a key skill for debugging endpoints on macOS. Let’s break down its essential components and methods.
HTTP Request and Response Structure
Every HTTP interaction is built around two main parts: the request and the response. Here’s what makes up each:
Request Components:
- Method: Specifies the action (e.g., GET, POST, PUT, DELETE).
- Headers: Includes details like authentication and content type.
- URL Parameters: Query strings appended to the URL.
- Request Body: Carries data for methods like POST or PUT.
Response Components:
- Status Code: Indicates the outcome of the request.
- Response Headers: Contains metadata about the response.
- Response Body: The actual data returned by the server.
- Timing Data: Captures how long the request took.
Status codes play a crucial role in understanding the result of HTTP requests. They fall into five categories:
| Category | Range | Meaning | Common Examples |
|---|---|---|---|
| Informational | 100-199 | Request received, processing | 100 Continue |
| Success | 200-299 | Request succeeded | 200 OK, 201 Created |
| Redirection | 300-399 | Further action needed | 301 Moved Permanently, 304 Not Modified |
| Client Error | 400-499 | Error in the request | 400 Bad Request, 404 Not Found |
| Server Error | 500-599 | Server-side failure | 500 Internal Server Error, 503 Service Unavailable |
Packet Capture Methods
Packet capture involves intercepting and recording network traffic, making it easier to spot issues. Here are two common approaches:
-
Command-line Capture
Use the built-intcpdumputility to capture raw traffic. This is great for identifying packet-level problems directly from the terminal. -
GUI-based Capture
Wireshark provides a user-friendly interface for detailed packet inspection. As recommended by Atlassian Support (April 2025), when sharing captured data for debugging, include:- The server IP addresses involved.
- The specific timeframe of the issue.
- A filtered capture focusing only on relevant traffic.
Traffic Monitoring Methods
Different monitoring techniques suit different debugging needs:
- Passive Monitoring: Observes traffic without interfering, helping identify patterns or bottlenecks.
- Active Monitoring: Actively intercepts traffic, enabling you to manipulate requests and responses for deeper debugging.
"By monitoring network traffic on mac, developers can uncover errors, missing data, or server-side problems, facilitating effective debugging." - Sagar Soni, Requestly
For secure debugging, handling HTTPS certificates correctly is critical. This includes installing root certificates and configuring proxy settings to ensure smooth traffic interception.
Next, we’ll explore how ReqRes simplifies these debugging processes on macOS.
ReqRes Setup Guide for macOS
Initial Setup Steps
Start by downloading ReqRes from its official website. Once installed, the app will require several permissions to function properly:
- Network Access: Approve ReqRes to monitor network traffic when prompted.
- Keychain Access: Allow it to manage certificates for secure connections.
- System Extensions: Enable the ReqRes system extension by going to System Preferences > Security & Privacy.
After granting these permissions, you’ll need to configure HTTPS settings to handle secure traffic.
HTTPS Setup
When you launch ReqRes for the first time, it will generate a root certificate. To set it up:
- Open Keychain Access and import the certificate.
- Set the certificate’s trust level to Always Trust. You’ll need to enter your admin password to confirm this change.
Once done, check the ReqRes dashboard for a green indicator to confirm everything is set up correctly.
Traffic Filter Settings
ReqRes offers powerful filtering options to help you zero in on specific types of network traffic. Here’s a quick look at the available filters:
| Filter Type | Example | Use Case |
|---|---|---|
| Domain Filter | api.example.com |
Monitor traffic for specific APIs |
| Method Filter | POST, PUT |
Focus on data-modifying requests |
| Status Code | 4xx, 5xx |
Debug error responses |
| Content Type | application/json |
Target JSON payloads |
You can also combine filters for more precise debugging. For example:
host: api.example.com AND method: POST AND !path: /health
To streamline your workflow further, consider these tips:
- Create and save custom filter profiles.
- Use wildcards for domains.
- Set up exclusion rules to ignore irrelevant traffic.
- Enable automatic logging of responses.
Finally, take advantage of the Map Local Tool to mock responses using local files. This is especially handy for testing without relying on external servers.
API Debugging with ReqRes
Following our discussion on HTTP structures and monitoring techniques, let's explore how ReqRes supports API debugging by analyzing requests, simulating responses, and reviewing traffic patterns in detail.
Request Analysis
ReqRes provides real-time insights into HTTP requests and responses, making it easier to pinpoint issues in key areas like:
- Headers: Examine authentication tokens, content types, and custom headers.
- Payloads: Check JSON/XML formatting and validate data structures.
- Status Codes: Monitor response codes to detect error patterns.
ReqRes organizes request data in a hierarchical format, making it simple to spot problems such as malformed JSON or incorrect Content-Type headers.
| Traffic Component | What to Monitor | Common Issues |
|---|---|---|
| Request Headers | Authorization tokens, Content-Type | Missing/expired tokens, incorrect content types |
| Request Body | Data structure, required fields | Malformed JSON, missing required parameters |
| Response Headers | CORS settings, caching directives | Misconfigured CORS, incorrect cache headers |
| Response Body | Data validation, error messages | Invalid data formats, unclear error responses |
Once issues in requests are identified, you can move on to testing scenarios using response mocking.
Response Mocking
ReqRes’s Map Local Tool allows you to use local files to simulate API responses, speeding up development and testing processes. Here’s how it works:
- Create a local JSON file containing the desired mock response.
- Set up rules to match requests based on path or method.
- Define the appropriate status codes and headers.
- Enable delay simulation to test loading states.
This approach helps developers test edge cases and error handling without relying on live APIs.
Traffic Pattern Review
Beyond examining individual requests, ReqRes enables you to analyze traffic patterns to uncover broader, systemic issues. This step is critical after establishing effective request analysis and response simulation.
| Load Type | Target Metrics | Warning Signs |
|---|---|---|
| Light Load | Under 200ms response time | Response times exceeding 500ms |
| Normal Load | Less than 1% error rate | Sudden spikes in 4xx/5xx errors |
| Peak Load | Stable throughput | Frequent connection failures |
Research shows that using hierarchical logging can cut troubleshooting time by 35%. ReqRes organizes traffic data to reveal:
- Authentication problems by tracking token validation patterns.
- Rate limiting issues through request frequency monitoring.
- Connection pooling efficiency by analyzing connection reuse.
- API versioning conflicts via header inspections.
With its straightforward plain-text displays, ReqRes simplifies traffic analysis. For secure traffic inspection, it operates as a man-in-the-middle proxy, logging traffic between applications and SSL web servers. This makes it a powerful tool for debugging complex API interactions.
ReqRes Development Setup
Incorporate ReqRes into your workflow to make debugging easier and more efficient.
Automated Debugging
With ReqRes's Map Local Tool, you can simulate API responses without needing to tweak your code. Here's how to structure your mock responses:
| Response Type | File Location | Purpose |
|---|---|---|
| Success Cases | mock-responses/success/ | Standard API responses |
| Error States | mock-responses/errors/ | Simulate HTTP error scenarios |
| Edge Cases | mock-responses/validation/ | Test input validation scenarios |
At Acme Corp in March 2025, using ReqRes for automated response mocking cut down debugging time by 40%.
To further streamline debugging, you can standardize configurations across your team by leveraging ReqRes's shareable profiles.
Team Profile Sharing
ReqRes simplifies collaboration by enabling shared profiles, ensuring that all team members debug using the same settings applied during automated tests. These profiles can include:
- Definitions for mock responses
- Rules for filtering traffic
- Custom header setups
- Environment-specific configurations
"ReqRes is the ultimate developer tool for capturing, intercepting, and debugging HTTP(s) traffic on macOS." - OloApps
CI/CD Integration
Take things a step further by integrating ReqRes into your CI/CD pipeline. This approach focuses on three main areas:
-
Test Automation
Automatically capture HTTP traffic during tests to detect regressions early. -
Response Validation
Validate API responses against predefined schemas to ensure consistency in payload structures and patterns. -
Performance Monitoring
Track response times and error rates across various test environments to maintain performance benchmarks.
For running API tests in CI/CD pipelines, you can pair ReqRes with Bruno-cli. Here's an example command:
bru run --env-var base_url="https://reqres.in" --reporter-html
This setup ensures consistent testing environments and generates detailed HTML reports for every test run.
macOS Debug Issues
When debugging on macOS, addressing system-specific challenges is just as important as analyzing HTTP traffic. Let’s dive into some common issues and their solutions.
Certificate Problems
HTTPS certificate errors can often interfere with traffic analysis on macOS. These issues typically require adjustments in Keychain Access or updates to system certificates.
| Issue | Solution | Impact |
|---|---|---|
| Expired Root CA | Update system certificates via Software Update | Fixes most SSL validation errors |
| Non-trusted CA | Manually trust the certificate in Keychain Access | Allows HTTPS inspection |
| Python SSL Issues | Install or upgrade the certifi package |
Ensures Python-based tools work smoothly |
For example, DevKinsta users on macOS Big Sur 11.1 ran into "your connection is not private" warnings when enabling HTTPS. Similarly, users encountered "SSL certificate problem: certificate has expired" errors with cURL when connecting to sites like kapeli.com. The culprit? Expired "AddTrust External CA Root" certificates. Keeping certificates updated through Software Update can prevent these headaches.
Port Conflicts
Port conflicts are another common issue that can interrupt HTTP traffic analysis. These conflicts often occur after an application crash or when multiple services attempt to use the same port.
To identify and resolve port conflicts, use the following commands in Terminal:
-
Find processes using a specific port:
lsof -i :port_number -
Terminate the conflicting process:
kill -9 process_id
After the macOS Sequoia 15.0.1 update, users reported random network disconnections due to port conflicts. Apple resolved this issue in version 15.1, underscoring the importance of managing ports effectively during debugging.
IPv6 Issues
Even after resolving port conflicts, macOS users might encounter IPv6-related challenges. Modern macOS systems often use both IPv4 and IPv6, which can complicate debugging.
To troubleshoot IPv6 issues:
- Test connectivity using
ping(for IPv4) andping6(for IPv6). - Enable Privacy Addressing to protect your MAC address.
- Use
dig AAAA example.comto verify DNS records for IPv6.
For instance, macOS Yosemite users experienced problems accessing IPv6 websites hosted on Mavericks OS X Server. Installing Security Update 2014-005 resolved the issue, showing how critical OS updates can be for maintaining IPv6 functionality.
Security Best Practices
When debugging HTTP traffic, having a secure HTTPS setup and monitoring traffic closely is just the beginning. Robust security measures are essential, especially when you consider that 82% of data breaches involve a human factor. This makes it critical to implement strong security protocols.
Data Redaction
Sensitive data must be masked during debugging using techniques like tokenization and data masking. A survey by K2view predicts that by 2025, 93% of companies will still struggle to fully comply with data privacy regulations. This underscores the need for proper data handling.
Here’s a quick guide to managing sensitive data during debugging:
| Data Type | Redaction Method | Implementation |
|---|---|---|
| API Keys | Tokenization | Replace with random characters while keeping the format intact |
| Personal Info | Data Masking | Substitute with realistic but fake information |
| Credentials | Full Redaction | Completely remove them from logs |
| Session Data | Partial Masking | Show only the first and last characters |
Credential Storage
Once data is redacted, securing credentials during reviews becomes a priority. Insider threats have risen 47% since 2018, costing companies an average of $200,000 annually.
If you’re using macOS, leverage its built-in security features to keep credentials safe:
- Turn on FileVault encryption to secure your drive.
- Restrict access to administrators only.
- Store temporary credentials securely in macOS Keychain.
Data Cleanup Rules
After securing data and credentials, automating cleanup processes adds an extra layer of protection. These measures can help safeguard your debugging sessions:
- Delete captured traffic data within 24 hours.
- Sanitize debug data in real time to remove sensitive information.
- Continuously scan for any accidentally logged sensitive data.
- Encrypt all captured traffic files.
- Monitor and log all access attempts to debug data.
- Perform weekly security audits to catch vulnerabilities early.
Conclusion
With over 70% of malware now encrypted, analyzing encrypted traffic has become a critical necessity.
ReqRes continues to push forward. Its April 2025 update (version 1.0.3) introduced enhanced traffic monitoring tools, adding layers of security and debugging improvements.
Here’s a quick overview of key areas in HTTP traffic analysis:
| Focus Area | Impact |
|---|---|
| Real-time Monitoring | Quickly detect and resolve issues |
| Security Integration | Ensure debugging environments stay secure |
| Response Handling | Speed up development with local file mapping |
| Traffic Pattern Analysis | Gain insights to optimize performance |
A crucial reminder from Tom Hudson:
"Validate all assumptions. Does that function really return what you think it does? Read documentation carefully. Check spelling, casing, punctuation. Actually read the error message instead of glancing at it."
– Tom Hudson
Establishing baselines and capturing packets provides teams with the visibility they need to understand application behavior. Combining real-time monitoring with automated anomaly detection helps teams stay ahead of potential issues.
Ultimately, effective HTTP traffic analysis relies on recognizing patterns, spotting anomalies, and taking swift action. This process is essential for building secure, high-performing applications and ensuring reliable endpoint debugging.
FAQs
How can I use ReqRes to debug API performance issues on macOS effectively?
To troubleshoot API performance issues on macOS using ReqRes, start by capturing and analyzing HTTP(S) traffic in real time. This allows you to closely examine requests and responses, making it easier to spot bottlenecks, errors, or inefficiencies in your API interactions.
Another helpful feature is the ability to mock endpoints. This lets you test how your application reacts to different scenarios, such as delayed responses or varying payloads. On top of that, ReqRes offers tools to track response times and payload sizes, giving you the insights needed to quickly address performance problems.
These capabilities can simplify the debugging process, helping you optimize your APIs for a smoother user experience.
What’s the difference between active and passive monitoring for HTTP traffic?
Active and passive monitoring are two distinct methods for examining HTTP traffic, each catering to different needs.
Active monitoring, also known as synthetic monitoring, involves sending out simulated requests to evaluate how endpoints respond. By imitating user interactions, this method allows you to test performance in various scenarios and spot potential problems before they affect actual users. It's particularly useful for controlled performance testing.
In contrast, passive monitoring focuses on observing real HTTP traffic as it happens. This method provides a live, detailed snapshot of system behavior and traffic patterns, making it ideal for diagnosing issues in real-world environments. While active monitoring helps anticipate performance, passive monitoring reveals how systems perform during actual usage.
How does ReqRes ensure sensitive data stays secure during HTTP traffic analysis?
ReqRes places a strong emphasis on safeguarding sensitive data while giving users the tools to analyze HTTP traffic effectively. With its advanced filtering options, you can zero in on specific traffic based on parameters like protocol, headers, or content type. This targeted approach helps minimize exposure and ensures sensitive information is handled responsibly.
The platform also supports HTTPS traffic, allowing for encrypted communication that shields data from interception or unauthorized access. Together, these features create a safe and secure space for monitoring and debugging HTTP traffic on macOS.