
How to debug HTTPS traffic?
-
Why It Matters:
- Fix security misconfigurations and weak encryption.
- Optimize performance by reducing bottlenecks and improving response times.
- Prevent serious breaches like the 2022 PostgreSQL vulnerability on IBM Cloud.
-
Quick Setup:
- Install a root certificate for tools like ReqRes.
- Configure proxies on macOS, iOS, or Android to intercept traffic.
- Use developer tools or proxy software to monitor requests and responses.
-
Key Techniques:
- Decrypt HTTPS traffic using SSL/TLS logging.
- Debug container traffic while maintaining security.
- Create mock API endpoints for testing edge cases.
-
Common Issues:
- Fix certificate errors (untrusted, expired, or revoked).
- Optimize HTTPS performance with HTTP/2, compression, and CDNs.
-
Tools to Use:
- Browser Dev Tools for real-time analysis.
- Proxy tools like ReqRes for deeper traffic inspection.
- Command-line tools for SSL/TLS validation.
Debugging HTTPS traffic helps secure applications, improve performance, and streamline development workflows. Dive into the article for detailed steps and advanced techniques.
Setting Up Your HTTPS Debug Environment
Here's how to configure a secure and efficient HTTPS debugging environment with ReqRes.
Install and Set Up Root Certificates
To intercept HTTPS traffic, you'll need to download and install ReqRes's root certificate through the application.
For macOS users:
- Install the ReqRes certificate.
- Open Keychain Access, double-click the certificate, expand the "Trust" section, and select Always Trust.
For testing on mobile devices:
- iOS Setup: Go to Settings > Wi-Fi, configure your proxy, visit ReqRes's certificate URL, and enable trust under Settings > General > About > Certificate Trust Settings.
- Android Setup: Add the following to your Network Security Configuration file:
<network-security-config>
  <debug-overrides>
    <trust-anchors>
      <certificates src="user" />
    </trust-anchors>
  </debug-overrides>
</network-security-config>
Configure Your Proxy Server
To ensure proper HTTPS debugging, set up your proxy server on macOS:
- System Proxy Setup: Open System Preferences > Network, click Advanced, navigate to the Proxies tab, enable the HTTPS proxy option, and input ReqRes's server details.
- Application-Specific Configuration: Within ReqRes, you can fine-tune settings by specifying custom port numbers, selecting monitored domains, and toggling HTTPS inspection for individual endpoints.
If your proxy or firewall performs SSL inspection, make sure to exclude certain domains to avoid conflicts.
Once these steps are complete, you're ready to monitor and analyze HTTPS traffic using ReqRes.
HTTPS Debugging with ReqRes
Once your setup is ready, you can dive into real-time HTTPS monitoring with ReqRes.
Monitor HTTPS Traffic in Real-Time
ReqRes makes it simple to keep an eye on HTTPS traffic, whether you're focusing on browser activity or capturing system-wide data.
Here’s how to get started:
- Open ReqRes and click on "Connect App" in the popup.
- Choose between browser-specific monitoring or a system-wide capture.
- Begin your debugging session.
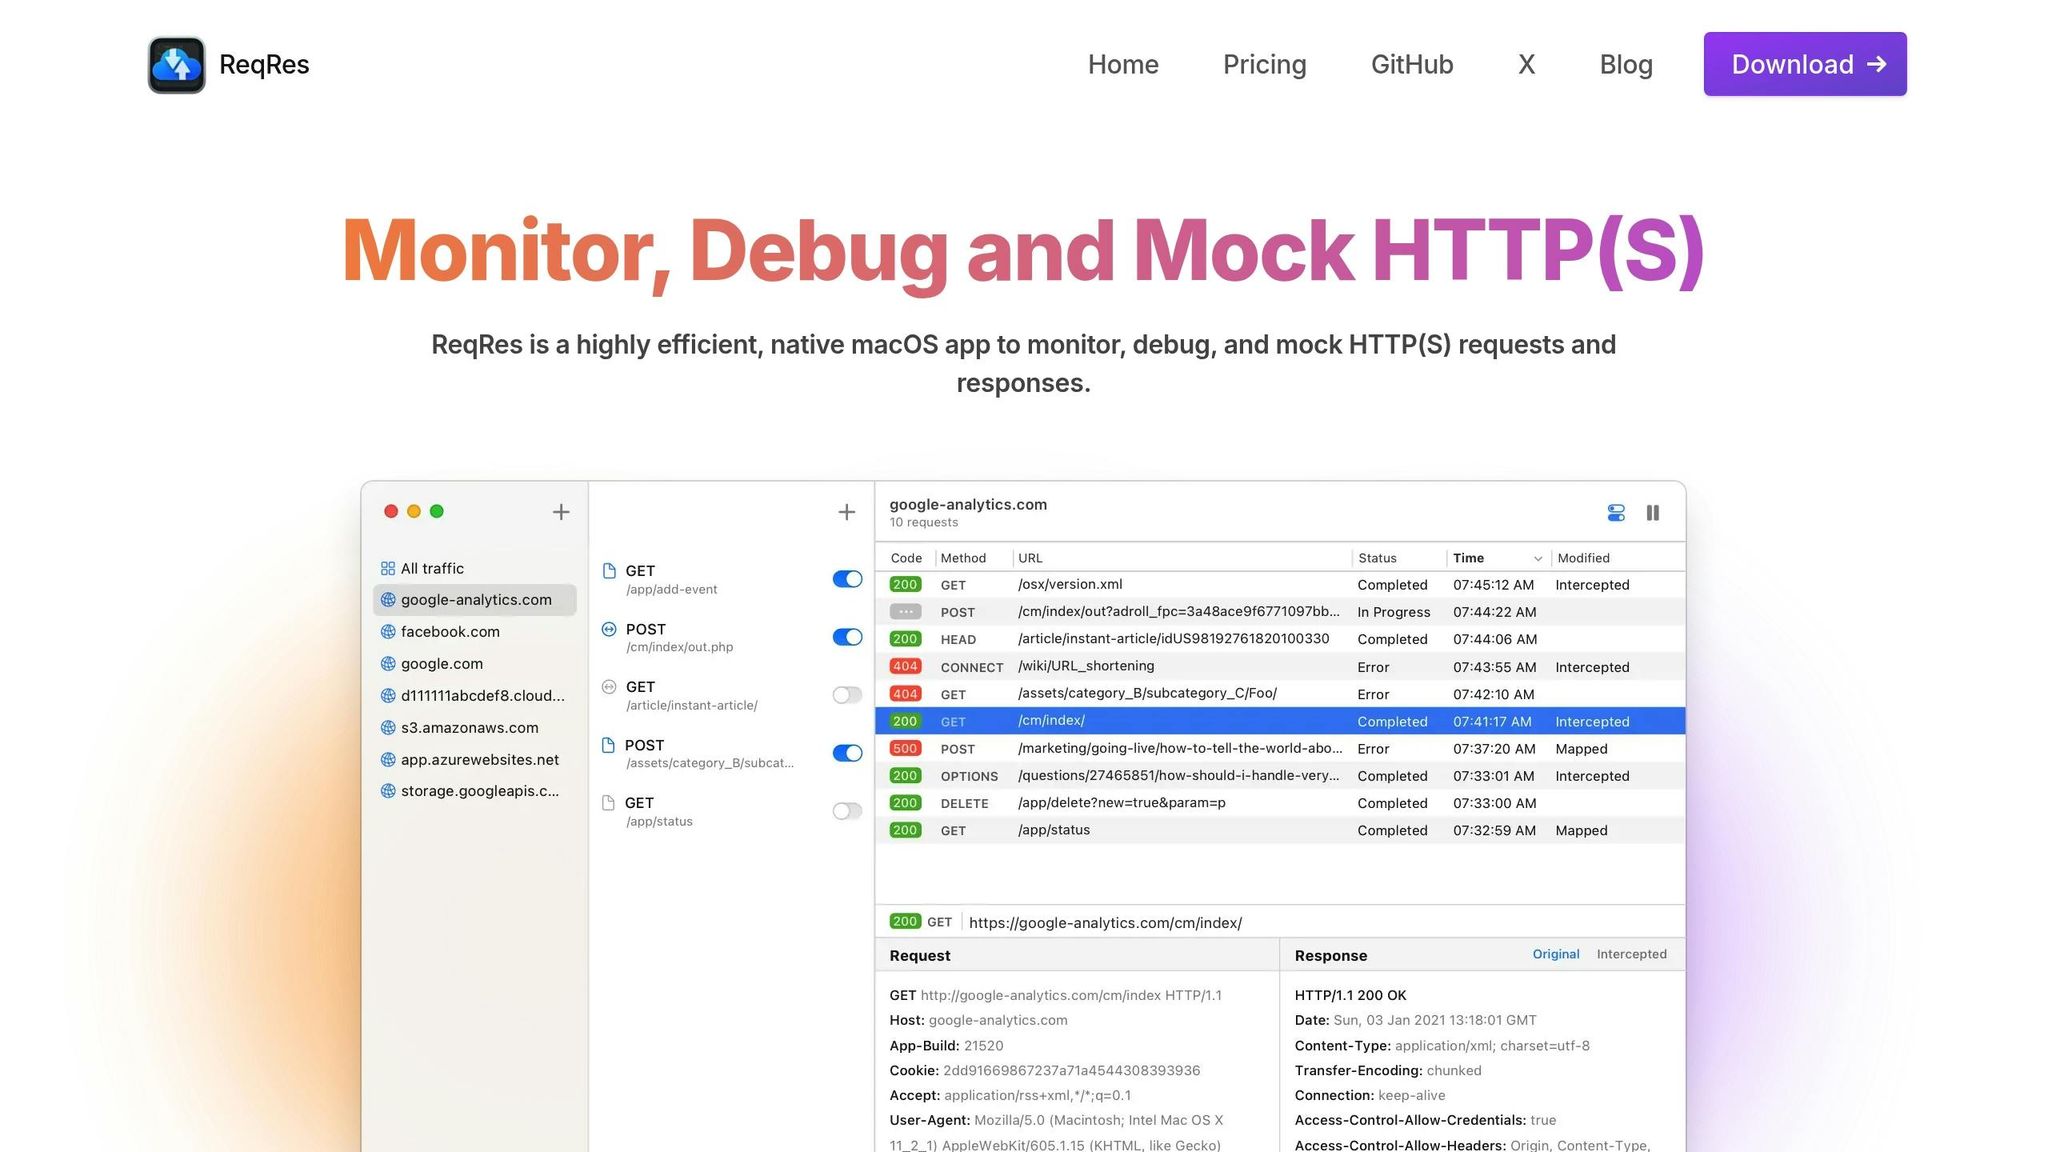
As requests come in, ReqRes displays details like the method, status, and response time for each. You can dig deeper by inspecting headers, bodies, or plain text responses to identify any issues.
Create Mock API Endpoints
The Map Local Tool in ReqRes lets you create mock API endpoints, making it a breeze to test without altering your application code. This is especially helpful when working with APIs that aren’t fully functional yet or when testing edge cases.
Here’s how it works:
- Select the request you want to target.
- Enable the Map Local Tool.
- Choose a local file to serve as the response.
For instance, you can simulate different HTTP status codes or test how your app reacts to varying API responses by mapping specific local JSON files to endpoints.
Filter and Export Traffic Logs
ReqRes provides powerful filtering options to zero in on the traffic that matters most during your debugging sessions. You can filter requests based on:
| Filter Type | Examples |
|---|---|
| Host | api.example.com, cdn.service.com |
| Method | GET, POST, PUT, DELETE |
| Status Code | 200, 404, 500 |
| Content Type | application/json, text/html |
Need to share your findings with your team? You can export filtered logs as HAR (HTTP Archive) files. These files include everything from timing data to headers and response content, giving your team a complete picture of the session.
To take your debugging further, you can even simulate network delays. Just add ?delay=<seconds> to any endpoint URL to see how your app handles slower responses.
Up next, we’ll dive into advanced HTTPS debugging techniques to refine your analysis further.
Advanced HTTPS Debug Methods
Advanced techniques can help you decrypt encrypted traffic and debug container environments, offering deeper insights into HTTPS traffic beyond basic real-time monitoring.
Decrypt HTTPS with SSL/TLS Logging
Once real-time monitoring is in place, you can dive deeper into HTTPS traffic by capturing session encryption keys. This is especially useful when dealing with Perfect Forward Secrecy (PFS).
-
Set Up Environment Variables
To capture encryption keys, define theSSLKEYLOGFILEenvironment variable:export SSLKEYLOGFILE=/path/to/sslkey.log -
Capture HTTPS Packets
Use ReqRes to begin capturing HTTPS traffic. The tool will automatically log SSL/TLS keys to the file specified in the environment variable. -
Analyze Decrypted Traffic
ReqRes allows real-time decryption of captured traffic, giving you access to key insights such as:Element What to Look For Headers Authentication tokens, content types Payload Request/response body contents Timing Connection establishment and data transfer times
Debug Container HTTPS Traffic
Debugging HTTPS traffic in containerized environments presents unique challenges due to their security and network isolation features. ReqRes simplifies this process while adhering to security best practices.
-
Follow Security Best Practices
Ensure your containers are secure by running non-root processes, limiting capabilities, enforcing network policies, and enabling TLS for all communications. -
Monitor Container Traffic
ReqRes offers tools to inspect container communications without breaching isolation boundaries:-
Network Isolation
Analyze traffic between containers while respecting their network namespaces. -
Security Controls
Maintain strict access controls during debugging:Control Type Implementation Network Segmentation Isolate traffic by service Access Control Define allowed communication paths TLS Verification Validate certificate chains -
Resource Management
Monitor and manage system resources during debugging with options like:--security-opt=no-new-privileges --cpus=0.5 --memory=512m
-
Network Isolation
Fix Common HTTPS Debug Problems
When working with HTTPS traffic, you might run into certificate errors or performance slowdowns. Let’s dive into practical ways to address these common issues.
Fix Certificate Errors
Certificate problems can interfere with HTTPS debugging and may lead to security warnings. Here’s a quick guide to tackling frequent certificate issues:
| Error Type | Common Cause | Solution |
|---|---|---|
| Untrusted Certificate | Missing root certificate | Install the root CA certificate |
| Mixed Content | HTTP resources on HTTPS pages | Enforce HTTPS for all resources |
| Revoked Certificate | Invalid certificate | Renew the certificate |
| Expired Certificate | Missed renewal date | Renew before the expiration date |
Here’s how to troubleshoot and resolve these issues:
-
Verify Certificate Details
Click the padlock icon in your browser’s address bar to inspect certificate details. Check the issuer, validity period, and domain name to ensure they’re correct. -
Review the Certificate Chain
Confirm that all certificates in the chain link back to a trusted root Certificate Authority. Use tools like ReqRes’s certificate viewer to identify any missing intermediate certificates. -
Test SSL Configuration
Run online SSL testing tools to detect configuration issues. For example, the Biodiversity Management Bureau in the Philippines achieved zero data breaches by using GlobalSign SSL certificates.
Once you’ve sorted out certificate errors, it’s time to focus on improving HTTPS performance.
Improve HTTPS Performance
After fixing certificate problems, you can optimize your site’s speed and overall performance.
Monitor Key Metrics
Keep an eye on Web Vitals to measure performance effectively:
| Metric | Target Value | Impact |
|---|---|---|
| Largest Contentful Paint (LCP) | < 2.5 seconds | Affects how fast the page feels to load |
| First Input Delay (FID) | < 100ms | Improves interactivity |
| Cumulative Layout Shift (CLS) | < 0.1 | Ensures visual stability |
Optimize TLS Configuration
Boost performance by tweaking your TLS and related settings:
- Use HTTP/2 or HTTP/3 instead of HTTP/1.x for better speed.
- Enable GZIP compression to minimize file sizes during transfer.
- Set up a Content Delivery Network (CDN) to deliver content faster.
- Place CSS links in the
<head>and move scripts to the bottom of your page, just before the closing</body>tag.
For more complex applications, Server-Side Rendering (SSR) can make a big difference. Frameworks like Next.js or Nuxt.js offer built-in SSR features, which can significantly improve initial page load times.
If animations are part of your site, stick to CSS transitions and transforms rather than JavaScript-based animations. These can be offloaded to the GPU, resulting in smoother performance.
Conclusion: Key HTTPS Debug Skills
Building on the techniques discussed earlier, honing these essential skills can elevate your ability to debug HTTPS effectively. By focusing on protocols, tools, and security practices, you’ll be well-equipped to handle HTTPS debugging challenges.
- Protocol Knowledge Understanding the ins and outs of HTTP/HTTPS protocols and SSL/TLS encryption is fundamental. This knowledge helps you analyze traffic patterns and pinpoint potential vulnerabilities.
-
Proficiency with Tools
Different tools serve unique purposes when it comes to HTTPS debugging. Here's a quick breakdown:
Tool Type Key Benefits Browser Dev Tools Analyze requests and responses in real time Command Line Tools Verify SSL/TLS configurations directly Proxy Tools Inspect encrypted traffic efficiently - Security Practices Adopting a security-first approach is crucial. Use techniques like managing API keys with environment variables, implementing IP whitelisting, monitoring authentication attempts, and setting time-limited tokens.
These skills are essential for ensuring secure, efficient, and reliable HTTPS performance, especially within environments like the ReqRes ecosystem.
FAQs
What are the best practices for securely debugging HTTPS traffic on mobile devices?
To debug HTTPS traffic securely on mobile devices, the first step is making sure your app strictly enforces HTTPS for all network communication. This guarantees that data stays protected during transmission. Trusted tools like Charles Proxy or Fiddler can be used to intercept and analyze traffic effectively. For decrypting HTTPS traffic, you'll need to install the required certificates on your mobile device and ensure the tools are configured correctly.
If you're working with Android devices, enable USB debugging and take advantage of Chrome DevTools to inspect network requests directly within the browser. Make it a priority to validate SSL certificates, implement secure authentication methods like OAuth2, and keep your debugging tools up-to-date to minimize vulnerabilities. These steps help maintain a secure and smooth debugging process.
How can I troubleshoot common SSL certificate errors when debugging HTTPS traffic?
When troubleshooting SSL certificate errors while working with HTTPS traffic, start by confirming the certificate's validity and ensuring it hasn't expired. Double-check that the certificate matches the domain name you're trying to access - any mismatch can lead to errors. Also, verify that the full certificate chain, including intermediate certificates, is properly installed.
Don't overlook your system's date and time settings; incorrect configurations here can disrupt certificate validation. If you're seeing mixed content warnings, make sure all resources on the page are served over HTTPS. For a more detailed investigation, tools like Wireshark or browser developer tools can help you analyze HTTPS traffic and identify the underlying issue. A thorough approach to debugging ensures secure and stable communication.
What are some advanced methods for decrypting HTTPS traffic during debugging?
To break down HTTPS traffic for a closer look, there are a few advanced methods you can use:
- SSL/TLS Key Logging: By setting up an environment variable to log session keys, you can import these keys into tools like Wireshark. This allows you to decrypt traffic while keeping the process secure.
- Private RSA Keys: If you have access to the server's private RSA key, you can configure tools like Wireshark to decrypt HTTPS communications effectively.
- Proxy Tools: Tools like Fiddler or Charles Proxy act as intermediaries by installing their own trusted root certificates in your browser. This enables them to decrypt HTTPS traffic seamlessly.
It’s crucial to always adhere to ethical and legal standards when working with HTTPS traffic. Handle any sensitive data responsibly to protect privacy and maintain security.