
Top 5 HTTP Debugging Techniques for macOS Developers
HTTP debugging is essential for building reliable macOS applications. Here’s a quick summary of the five best techniques to simplify your debugging process:
- Monitor HTTP(S) Traffic: Use tools like ReqRes to view real-time API requests and responses, inspect headers, and analyze payloads.
- Set Breakpoints: Pause and modify HTTP traffic to test different scenarios without changing your code.
- Create Mock Endpoints: Simulate API responses to test your app without relying on live servers.
- Filter Traffic: Isolate specific requests using advanced filtering options like URL patterns, headers, or JSON queries.
- Set Up SSL Proxying: Decrypt HTTPS traffic securely to inspect encrypted API communications.
These techniques help troubleshoot errors, optimize performance, and secure your app’s API interactions. Whether you’re debugging encrypted traffic, testing API responses, or analyzing network slowdowns, these strategies streamline your workflow and save time.
| Technique | Primary Use | Key Features |
|---|---|---|
| Traffic Monitoring | Real-time API visibility | Inspect headers, payloads, and responses |
| Breakpoints | Modify requests on the fly | Pause, edit, and test traffic scenarios |
| Mock Endpoints | Simulate API responses | Test success, error, or delay handling |
| Traffic Filtering | Focus on specific requests | Filter by protocol, headers, or JSON content |
| SSL Proxying | Debug encrypted HTTPS traffic | Decrypt and inspect secure connections |
Let’s dive into how each method works and how you can use them effectively.
1. Monitor HTTP(S) Traffic with ReqRes
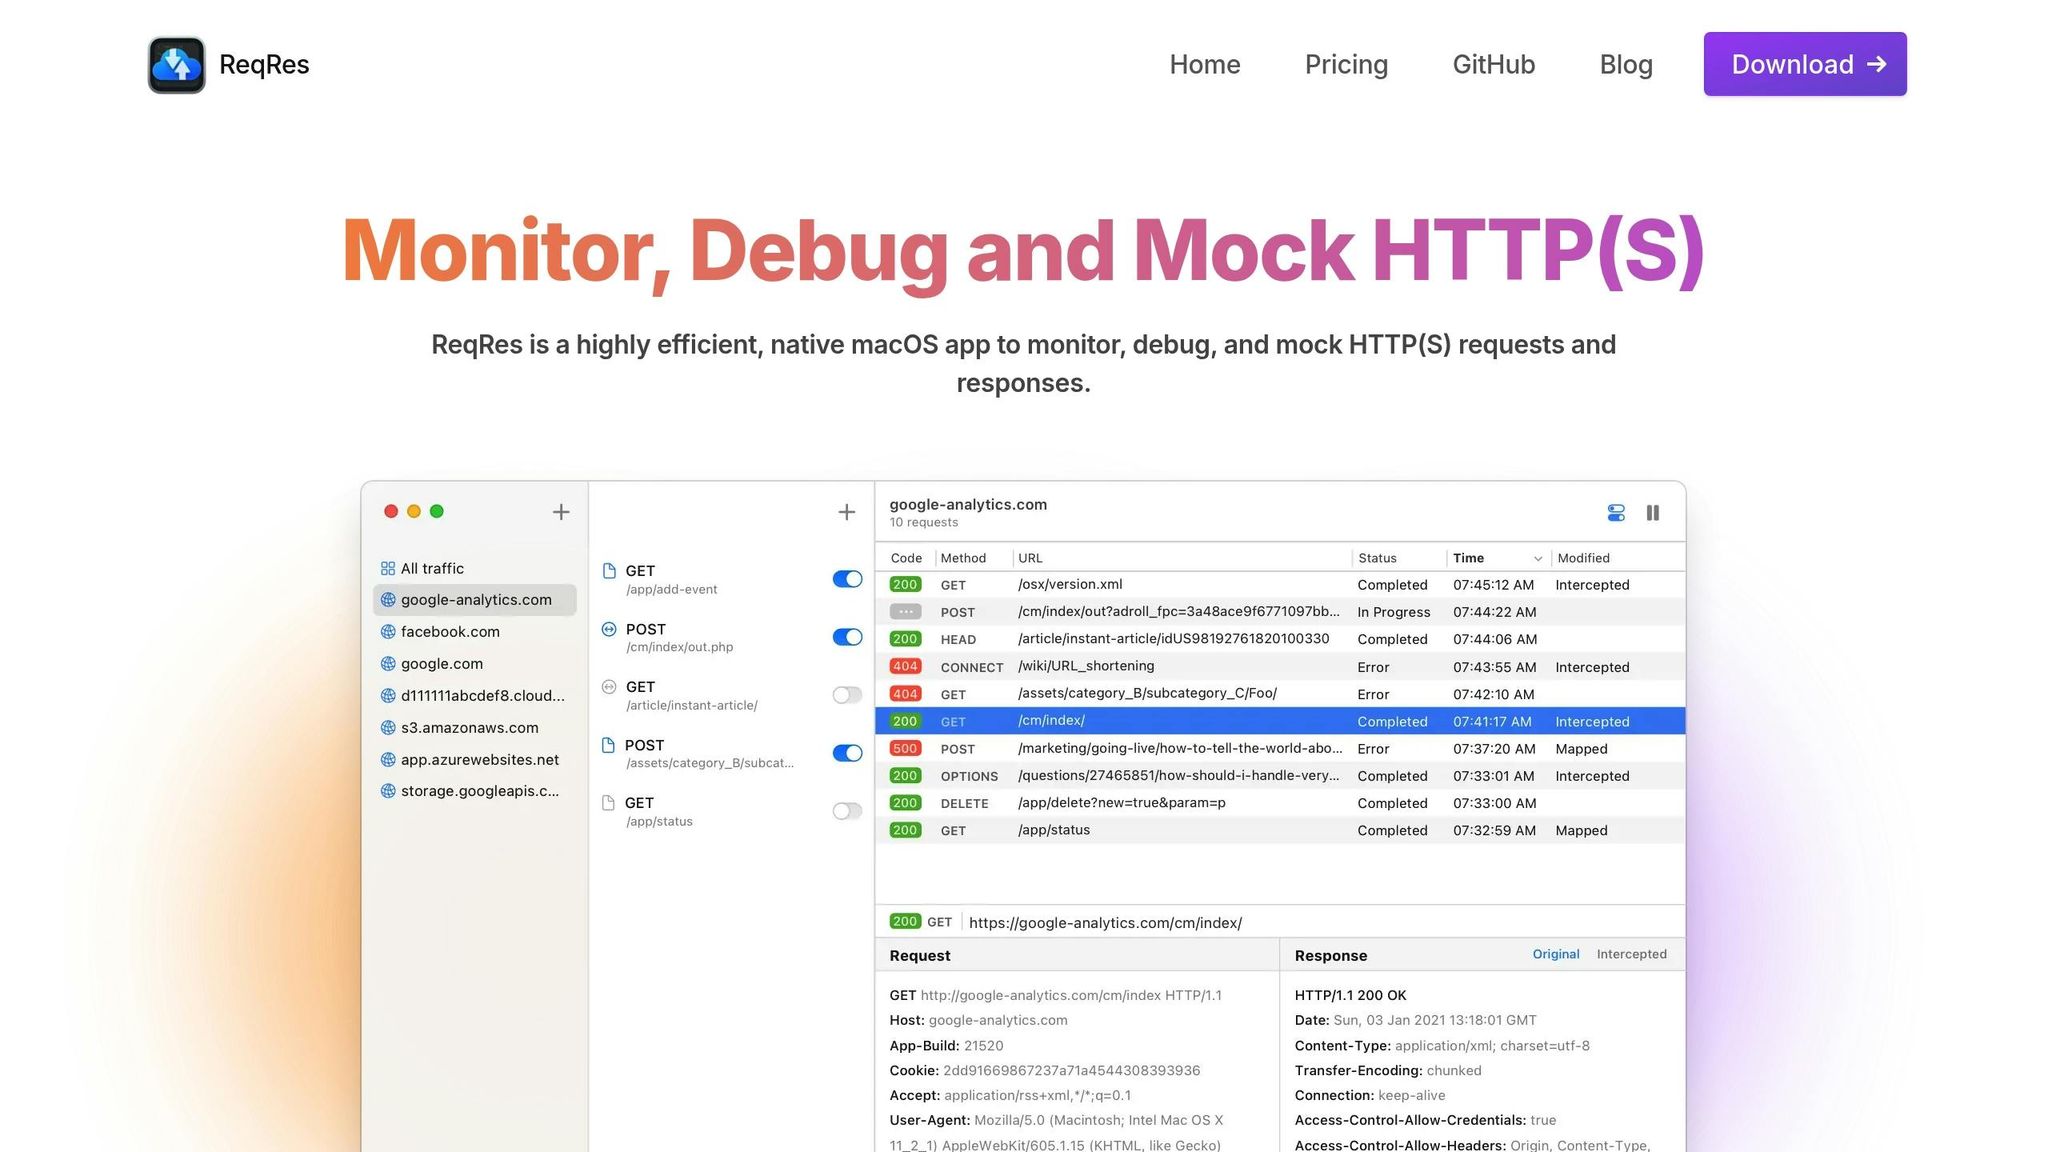
ReqRes offers a real-time solution for monitoring HTTP(S) traffic, tailored specifically for macOS developers. As a macOS-native app, it seamlessly integrates into your workflow, providing instant visibility into API communications. With its ability to display requests and responses as they happen, it simplifies debugging during development. Handling nearly half a billion requests monthly, ReqRes delivers the reliability needed for projects of any size.
Key Features for Monitoring
- Real-Time Request Inspection: Access complete details like headers, parameters, and body content as requests are made.
- Response Analysis: Review response codes, headers, and payload data for all HTTP methods, including GET, POST, PUT, and DELETE.
- Cross-Origin Support: Built-in CORS functionality allows monitoring requests from any domain without extra setup.
Advanced Simulation Tools
ReqRes also includes powerful simulation features to enhance testing:
| Feature | Purpose | How to Use |
|---|---|---|
| Delay Simulation | Test loading behaviors | Add ?delay=X to the endpoint URL |
| Authentication Testing | Verify token processes | Monitor token-related responses |
| Content Type Validation | Check proper formatting | Confirm application/json usage |
For example, adding ?delay=3 to an endpoint URL introduces a 3-second delay, helping you test how your application handles slow responses.
Simplified Traffic Monitoring
The macOS-native interface organizes all HTTP(S) traffic in chronological order. You can filter, export data, and monitor multiple endpoints simultaneously. This is especially useful for frontend developers, as ReqRes eliminates the need to manually generate sample data. This saves time and ensures your application's network interactions are accurately tested.
Up next, explore how breakpoints let you control traffic with precision.
2. Use Breakpoints for Traffic Control
Breakpoints are a powerful tool for pausing, inspecting, and adjusting HTTP traffic during debugging. They go beyond real-time monitoring by giving you the ability to stop and intervene in traffic flow. This is especially helpful when troubleshooting complex API interactions or testing specific scenarios in macOS applications.
Setting Up Breakpoints
ReqRes allows you to control traffic by setting breakpoints at specific locations. You can use patterns that match the protocol, host, port, and path of a URL to focus on the exact traffic you need to analyze.
| Breakpoint Action | Purpose | When to Use |
|---|---|---|
| Execute | Apply changes and continue | Testing modified requests or responses |
| Abort | Block and return an error | Simulating failure scenarios |
| Cancel | Skip without making changes | Ignoring unnecessary stops |
Modifying Requests in Real Time
Breakpoints let you intercept and adjust API traffic at key moments. When a breakpoint is triggered, you can:
- Inspect request headers and payloads
- Change API parameters before they reach the server
- Test different response scenarios without altering your code
- Check how your application handles errors or unexpected data
Example: Debugging with Breakpoints
Here's a practical use case: A developer used breakpoints to tweak an API request, changing a search query from "eat clean" to "mountain." This allowed them to see how the application processed the modified response. By doing this, they could test various scenarios without touching the backend or deploying new code.
Using URL Matching Patterns
To keep your debugging process efficient, you can configure breakpoints with URL matching patterns. This ensures that only relevant requests are intercepted while the rest of the traffic flows as usual. For example, you might set breakpoints for specific API endpoints or domains, making it easier to focus on the traffic you care about.
This approach helps you test how your application reacts in different situations, whether it's handling successful responses or dealing with simulated errors.
3. Create Mock Endpoints for Testing
Mock endpoints allow you to mimic API responses without needing live servers or external systems.
Setting Up Mock Responses
ReqRes simplifies the process of creating mock endpoints using its Map Local Tool. This tool lets you link local files to specific endpoints, giving you full control over the responses your application receives during testing.
Some common response types include:
| Response Type | Use Case | Purpose |
|---|---|---|
| Success (200) | Testing normal flow | Ensure correct data handling |
| Error (4xx/5xx) | Handling failures | Test how the app manages errors |
| Delayed | Simulating slow APIs | Check timeout behavior |
| Custom Headers | Authentication tests | Validate security mechanisms |
Best Practices for API Mocking
To get the most out of your mock endpoints, keep these tips in mind:
-
Start Early in Development
Introduce mocking early to define endpoints and functionality before the backend is fully built. This enables frontend teams to work independently. -
Keep Mocks Accurate
Ensure mock responses match your API contracts to avoid inconsistencies. Regularly update them as the API evolves. -
Use Realistic Data
Populate mock responses with data that reflects real-world scenarios. This approach can help catch potential issues before production.
Advanced Mocking Strategies
Go beyond basic endpoint mapping by simulating challenging conditions, like high latency or unexpected errors. These scenarios allow you to test the app’s resilience under less-than-ideal circumstances.
Integration with Development Workflow
Incorporate mock endpoints into your CI pipeline for automated testing. Doing so ensures a consistent testing environment across your team and helps maintain reliable application performance under various conditions. For better organization, document your mock endpoints with details like:
- Endpoint descriptions and purposes
- Expected request formats
- Sample response payloads
- Common testing scenarios
- Any limitations or special considerations
These practices will help streamline your workflow and improve testing accuracy. Next, we’ll look at ways to refine your debugging process.
4. Apply Filters for Traffic Analysis
Filtering helps identify specific requests and spot patterns in large volumes of HTTP traffic. ReqRes simplifies debugging with its powerful filtering options.
Advanced Filtering Techniques
Here are some effective filtering methods:
| Filter Type | Purpose | Example Use Case |
|---|---|---|
| Protocol | Isolate certain traffic types | Focus on HTTPS traffic for security evaluations |
| Content-Type | Target specific data formats | Monitor JSON responses from API endpoints |
| URL Pattern | Track specific endpoints | Follow all requests to /api/v1/users/* |
| Header Content | Find requests with key headers | Spot authentication-related traffic |
| Response Body | Search response content | Identify specific data patterns in API responses |
These filters lay the groundwork for more detailed JSON data queries.
Using JSONPath for Complex Queries
ReqRes's JSONPath feature makes it easier to pinpoint data within JSON responses:
- Basic JSON Filtering: Press ⌘F to activate filter mode. Use text search or regex to scan through large payloads.
- KeyPath Navigation: Focus on specific JSON nodes by applying KeyPath filters.
- Pattern Matching: Use regex in the JSON Previewer to detect inconsistencies or recurring data patterns.
Best Practices for Filter Usage
Refine your approach with these tips:
- Start Broad, Then Narrow: Begin with general filters and add criteria step-by-step to zero in on specific issues.
- Save Common Filters: Set up presets for frequently used filters to save time during future debugging.
- Combine Filters: Use multiple criteria like protocol, content-type, and URL filters together for detailed analysis.
Real-time Analysis Tips
When analyzing live traffic, effective filtering can help you:
- Quickly locate requests that match specific patterns
- Evaluate response times for targeted endpoints
- Observe header changes across filtered requests
- Track real-time payload modifications
5. Set Up SSL Proxying for HTTPS Inspection
SSL proxying is a powerful way to inspect encrypted API traffic, enabling you to debug secure connections effectively on macOS.
This method decrypts HTTPS traffic, allowing you to analyze it in plain text. ReqRes simplifies the process by handling certificate management for macOS developers.
How SSL Proxying Works
ReqRes uses a man-in-the-middle approach to decrypt HTTPS traffic. This lets you view secure data in plain text, which is essential for debugging web apps and API integrations.
How to Install Certificates
-
Automatic Installation (Preferred Method)
- Open the Certificate menu.
- Choose "Install Certificate on Mac."
- Enter your administrator password when prompted.
- Check that the status shows "Installed & Trusted."
-
Manual Installation
- Generate a certificate in the Certificate settings.
- Add it to the System Keychain and set it to 'Always Trust.'
- Restart your development environment to apply changes.
Tips for Secure SSL Inspection
To keep your SSL inspection secure and efficient, follow these guidelines:
| Aspect | Recommendation | Why It Matters |
|---|---|---|
| Certificate Scope | Limit to development domains | Minimizes security vulnerabilities |
| Trust Settings | Remove certificates post-debugging | Prevents unauthorized access |
| Testing Environment | Use separate browser profiles | Keeps testing isolated |
| Certificate Updates | Regularly update certificates | Ensures secure connections |
Key Security Practices
When using SSL proxying, prioritize security by:
- Generating a unique certificate for each project.
- Regularly reviewing and removing outdated certificates.
- Deleting debugging certificates once testing is complete.
- Keeping ReqRes updated to leverage the latest security measures.
Advanced Configuration Options
Enhance your SSL proxying setup with these advanced tweaks:
- Set up rules for specific domains.
- Customize SSL protocols to suit your needs.
- Adjust response caching settings for better performance.
- Create bypass rules for sensitive endpoints.
With SSL proxying configured and these strategies in place, you're well-equipped to debug secure connections efficiently.
Conclusion
Mastering HTTP debugging is key to building reliable macOS apps. By using these five methods, you can simplify client-server communication and create an efficient debugging process. From monitoring traffic in real time to securely inspecting HTTPS traffic, these techniques ensure a smoother workflow for macOS developers.
Combining tools like real-time traffic monitoring, breakpoint control, mock endpoints, filtered analysis, and SSL proxying provides a comprehensive debugging setup. These methods make it easier to identify errors, locate missing data, and address server-side issues effectively.
| Debugging Aspect | Primary Benefit | Impact on Development |
|---|---|---|
| Traffic Monitoring | Real-time insight | Speeds up troubleshooting |
| Breakpoint Control | Step-by-step debugging | Allows detailed examination of request flows |
| Mock Endpoints | Independent testing | Speeds up development without relying on the backend |
| Traffic Filtering | Targeted analysis | Focuses debugging efforts on specific API endpoints |
| SSL Proxying | Secure HTTPS inspection | Enables thorough analysis of encrypted traffic |