
Top Tools for HTTP Lifecycle Debugging
Debugging HTTP traffic can be tricky, but the right tools simplify the process. Whether you're troubleshooting API calls, inspecting HTTPS traffic, or mocking server responses, these tools help you save time and improve efficiency. Here's a quick overview of the top tools for HTTP lifecycle debugging on macOS:
- ReqRes: Real-time monitoring, session organization, and local file mocking. Designed for macOS.
- Charles Proxy: A classic choice for SSL/HTTPS decryption, latency tracking, and breakpoint editing.
- Proxyman: Mac-native with features like GraphQL debugging, WebSocket support, and JavaScript scripting.
- HTTP Toolkit: Open-source tool for easy traffic interception and breakpoint-based editing.
- Mitmproxy: Open-source, Python-powered proxy for deep traffic manipulation and scripting.
Each tool offers unique features, from protocol support (HTTP/2, WebSocket) to advanced traffic manipulation. Choose based on your workflow and platform needs.
Quick Comparison
| Tool | Platform Support | Key Features | Protocol Support | Price |
|---|---|---|---|---|
| ReqRes | macOS (Native) | Real-time monitoring, local mocking | HTTP(S) | $59.99+ |
| Charles | Multi-platform | SSL decryption, latency tracking | HTTP, HTTPS | ~$50 |
| Proxyman | macOS (Native) | GraphQL debugging, scripting | HTTP(S), WebSocket | Commercial |
| HTTP Toolkit | Multi-platform | Open-source, breakpoint editing | HTTP(S), WebSocket | Free/Commercial |
| Mitmproxy | Multi-platform | Python scripting, open-source | HTTP(S), WebSocket | Free |
These tools make debugging faster, more precise, and less frustrating. Pick one that matches your needs and start solving issues with confidence.
1. ReqRes
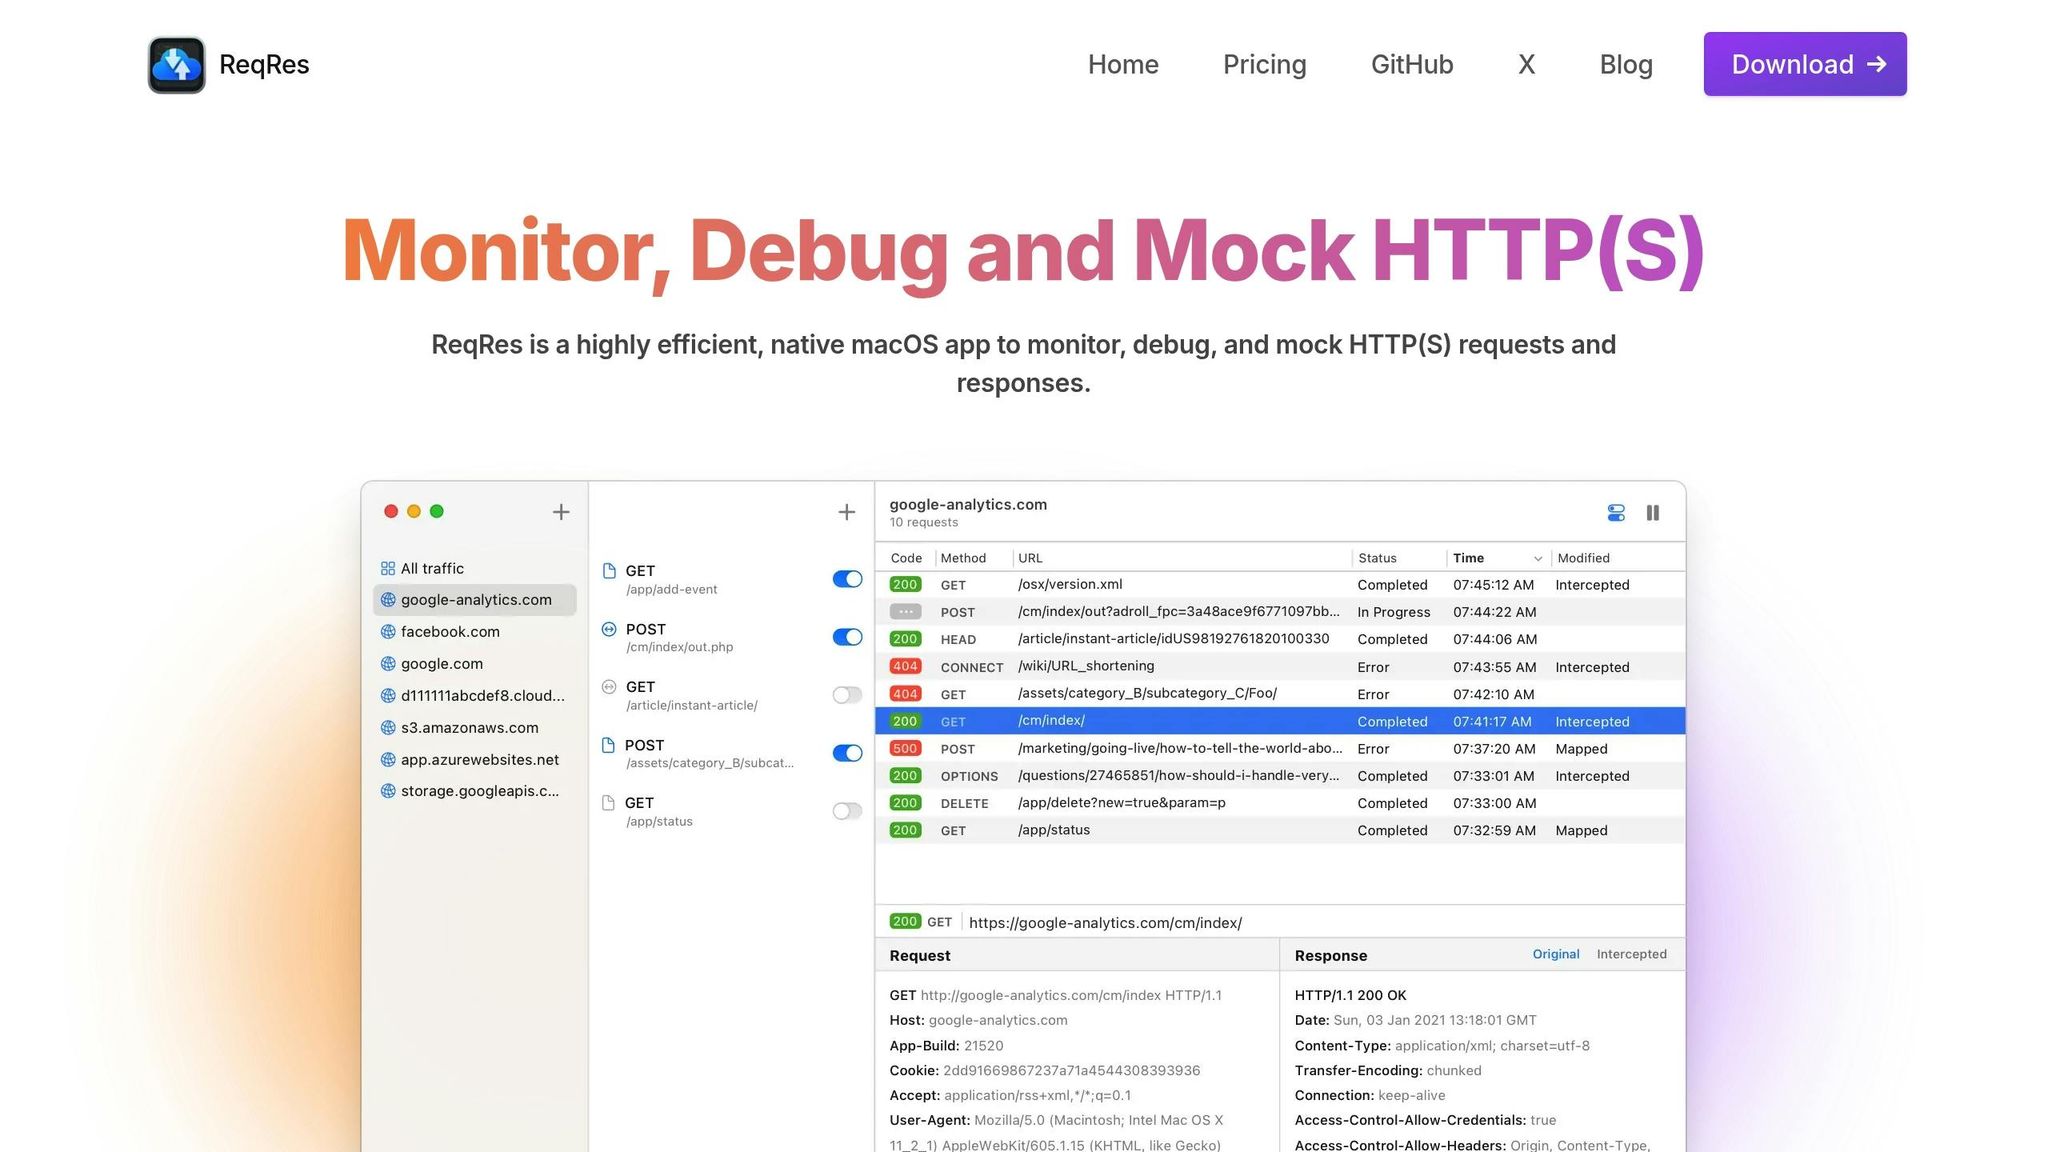
ReqRes is a macOS-native application that helps monitor and debug HTTP(S) traffic in real time. Acting as a proxy, it displays traffic details in plain text, making it easier for developers to identify and resolve issues.
Traffic Monitoring and Debugging Features
ReqRes captures HTTP(S) traffic across macOS apps, browsers, and APIs. Developers can dive into specifics like headers, HTTP methods, status codes, and payloads to troubleshoot problems such as malformed requests or unexpected responses. The app also includes advanced filtering and search tools, making it easy to locate specific requests or responses. Additionally, it allows users to organize sessions and export traffic logs for deeper analysis. These features, combined with its smooth integration into macOS, streamline the debugging process.
Built for macOS
Specifically designed for macOS, ReqRes integrates effortlessly into the native development workflow. With ongoing updates and improvements, it continues to adapt to the changing demands of Mac developers.
2. Charles Proxy
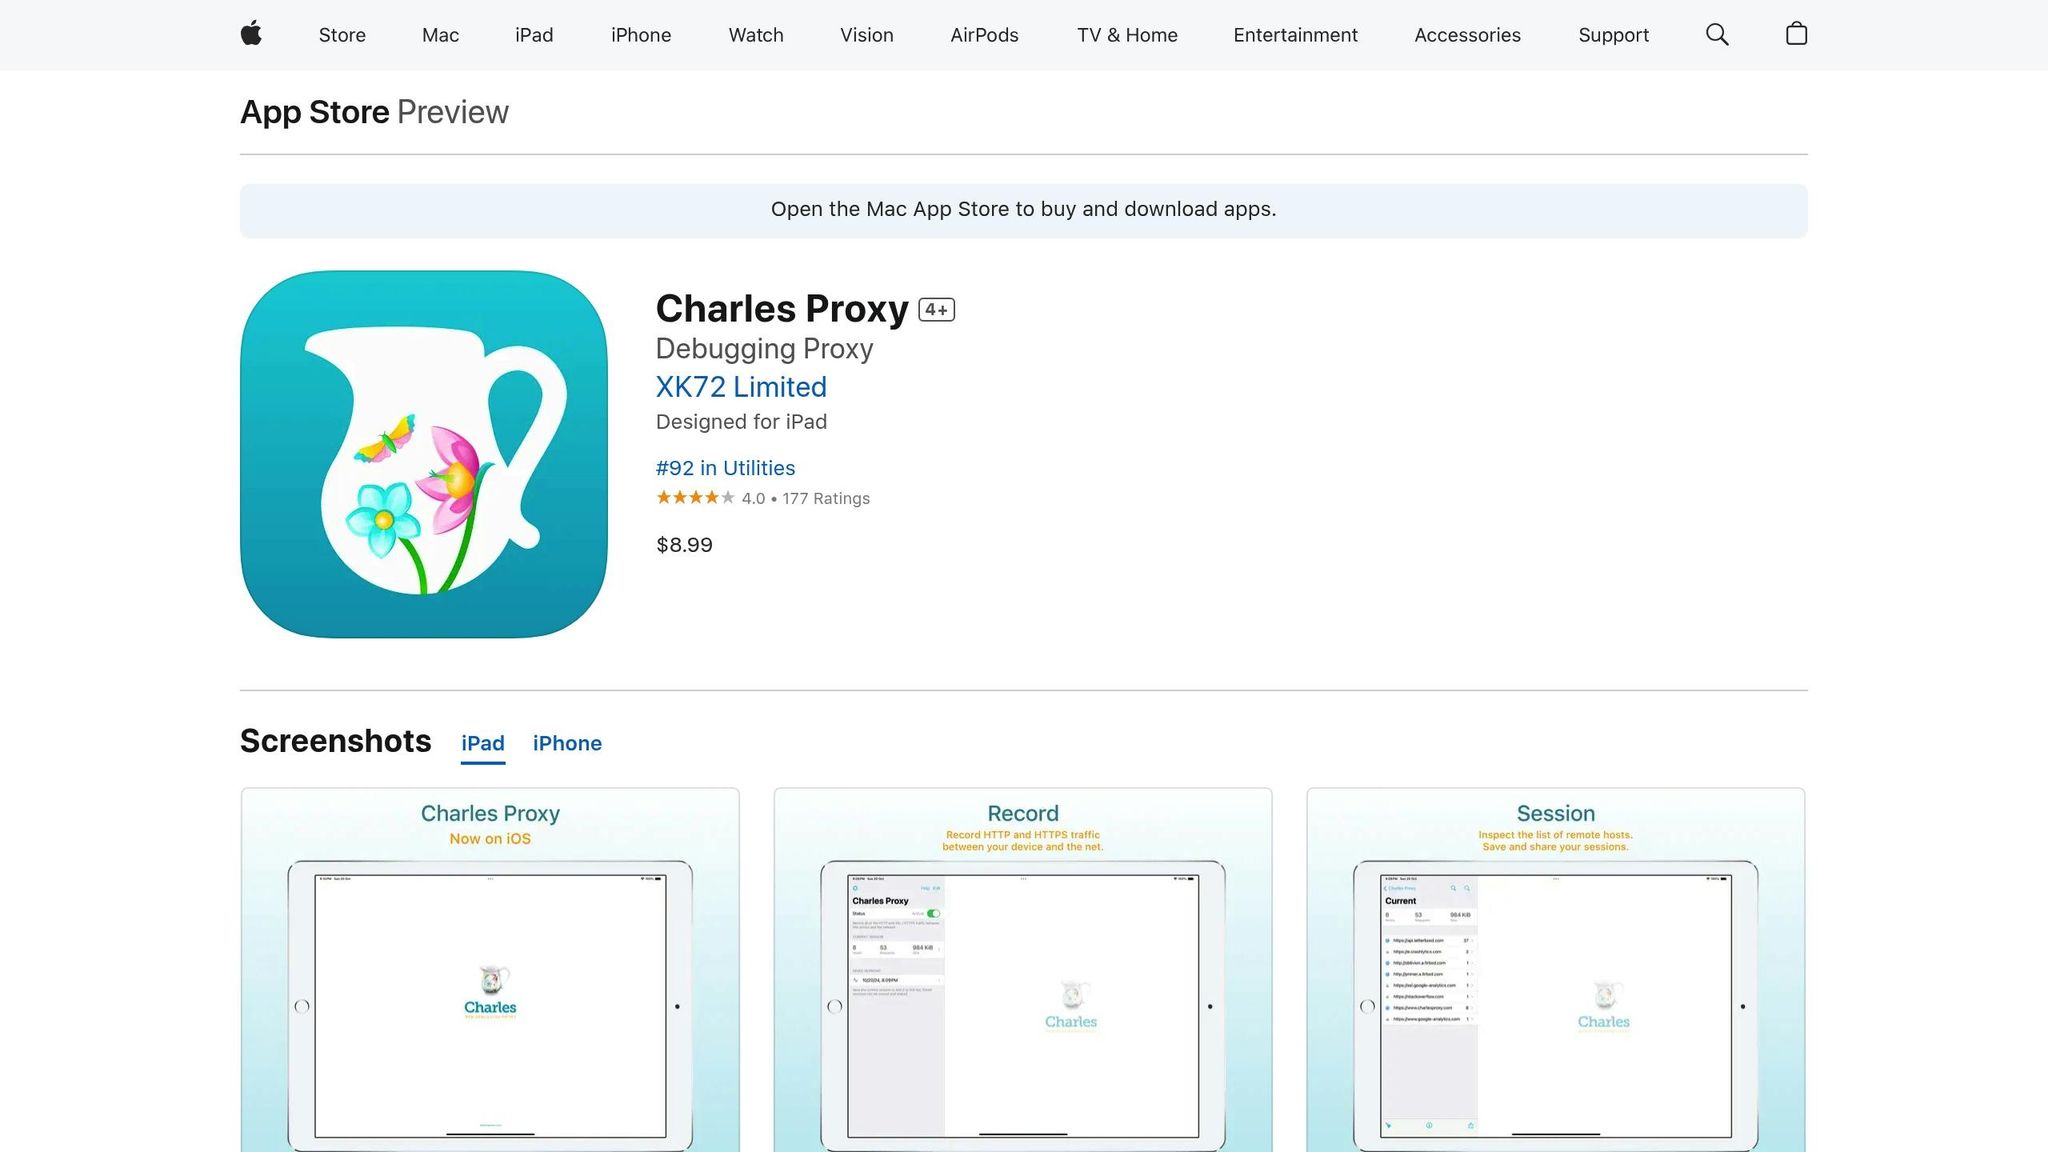
Charles Proxy has been a go-to HTTP debugging tool since 2002, providing a reliable way to monitor all HTTP and SSL/HTTPS traffic between your computer and the Internet. At a price of around $50 for a license, it offers professional-grade features without breaking the bank.
Traffic Monitoring and Debugging Capabilities
Charles shines when it comes to tracking and analyzing network traffic. It captures everything happening between your browser and the Internet, including requests, responses, cookies, and headers. This level of detail makes it an excellent tool for diagnosing API issues and understanding the behavior of web applications.
One standout feature is its ability to measure latency, specifically the time between completing a request and receiving a response. For developers working on local projects, Charles makes it easy to capture localhost traffic by using "http://localhost.charlesproxy.com/". It also helps identify encoding problems by letting you verify whether the server is correctly setting the character encoding or charset.
Support for Advanced Protocols (HTTP/2, WebSocket, etc.)
With the release of Charles 4, the tool introduced support for modern protocols like HTTP/2, IPv6, and WebSocket, along with an updated user interface. It also inspects HTTPS traffic by using a custom root certificate that can be trusted on both Android and iOS devices, making it a versatile option for mobile app testing.
Mocking and Request Manipulation Features
Charles includes powerful features for manipulating network traffic. You can use breakpoints to pause and edit traffic in real time, Map Local to replace server responses with local files, and the Rewrite tool to automatically adjust headers or status codes. It can even simulate HTTP errors, like a 500 Internal Server Error or a 400 Bad Request, and load responses from JSON files for testing purposes.
Seamless Integration with macOS
For macOS users, Charles integrates effortlessly into development workflows. It can also simulate different network conditions by limiting bandwidth, making it a handy tool for testing how applications perform under various scenarios.
3. Proxyman
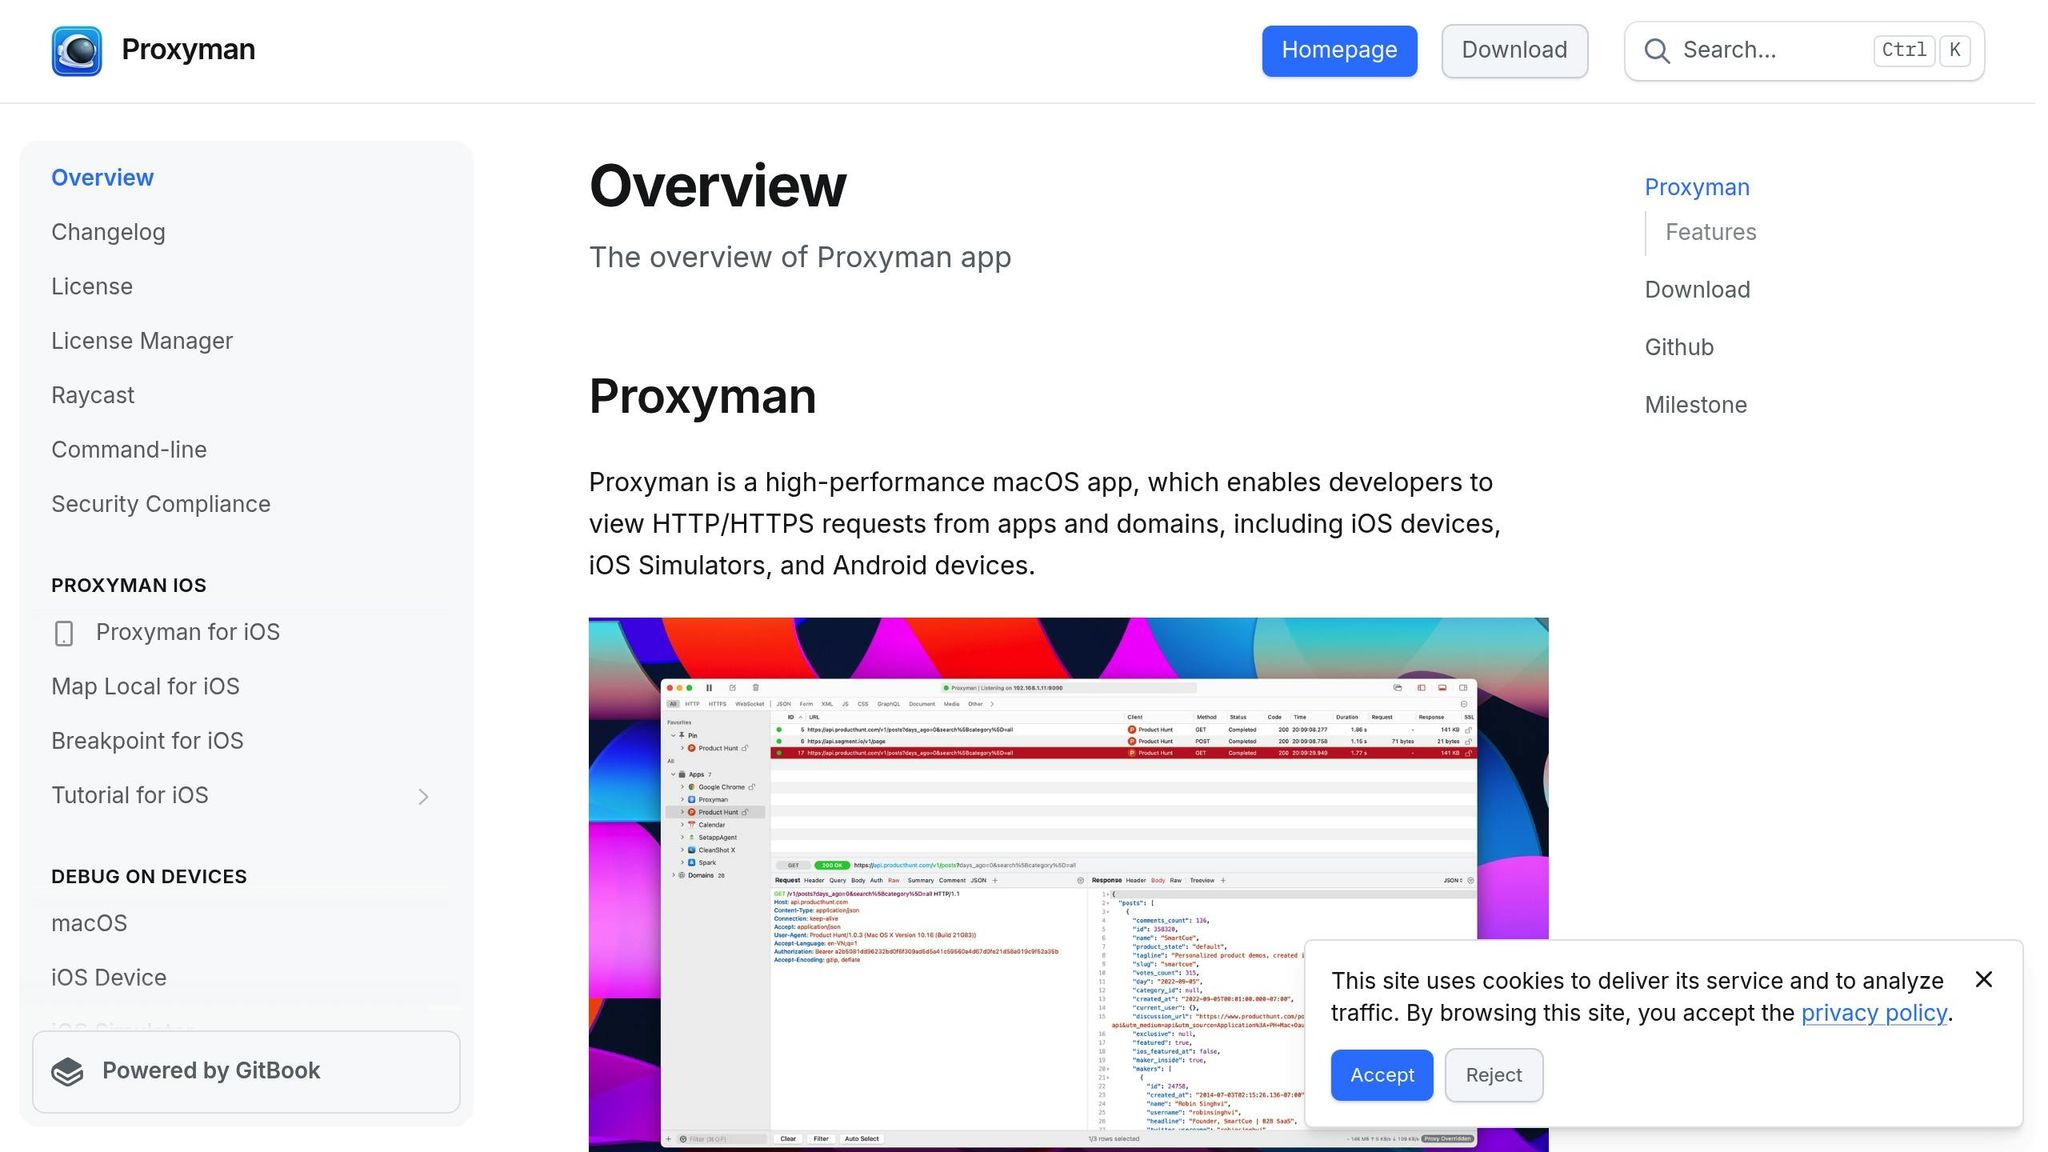
Proxyman is a native macOS application trusted by more than 250,000 developers and boasting a stellar 4.8/5 rating. It's built to help developers debug HTTP traffic and fine-tune web performance, offering a smooth, Mac-native experience that has made it a top choice for many professionals.
Traffic Monitoring and Debugging Capabilities
Proxyman is designed to intercept HTTP and HTTPS traffic, giving you a complete view of the request-response lifecycle. From API calls to web requests, it captures everything in real time, allowing you to inspect headers, body content, and response data. It even identifies which specific process is generating the web request, making network activity tracing much easier.
The tool comes with a built-in JSON viewer and a variety of filters - by protocol, content type, URL, headers, and body content - that can cut troubleshooting time by as much as 30%. For mobile developers, Proxyman can capture traffic from iOS and Android devices, simulators, and emulators. It also supports backend environments like NodeJS, Ruby, Python, and Golang without requiring any additional setup.
Support for Advanced Protocols (HTTP/2, WebSocket, etc.)
Proxyman supports modern protocols such as HTTP/2 and WebSocket, making it a versatile tool for developers. It captures and previews WebSocket (WS) and Secure WebSocket (WSS) traffic, with options to filter messages and view content in JSON, tree, or HEX formats. For web browsers and backend servers, it directly handles WS/WSS traffic. iOS apps using URLSessionWebSocketTask can also leverage Proxyman through a SOCKS proxy workaround.
Additionally, its Map Remote Tool allows you to redirect localhost WebSocket connections to production environments, making it easier to test in real-world scenarios. These features provide developers with a flexible and powerful way to manipulate requests.
Mocking and Request Manipulation Features
Proxyman offers a robust set of tools for request and response manipulation, seamlessly integrating with macOS. These include the Breakpoint Tool, which lets you make on-the-fly edits; the Map Local Tool, which allows you to mock responses using local files; and the Scripting Tool, which enables automated changes through JavaScript.
"Proxyman is such a cool app. You can view http/ws requests from any app on your computer, and install an SSL proxy cert so you can see requests/responses that apps on your computer are making. I've used many - wireshark, charles, etc - and this is the best one I've used." – Wes Bos
Ease of Integration with macOS
Proxyman is built to fit naturally into macOS workflows, featuring a user-friendly interface that simplifies SSL proxying and certificate management. Its zero-setup approach ensures that developers can get started quickly and efficiently.
"Have to say @proxyman_app is an absolutely phenomenal tool. I can't imagine using Charles with a native macOS app that works so well." – Shai Mishali
4. HTTP Toolkit
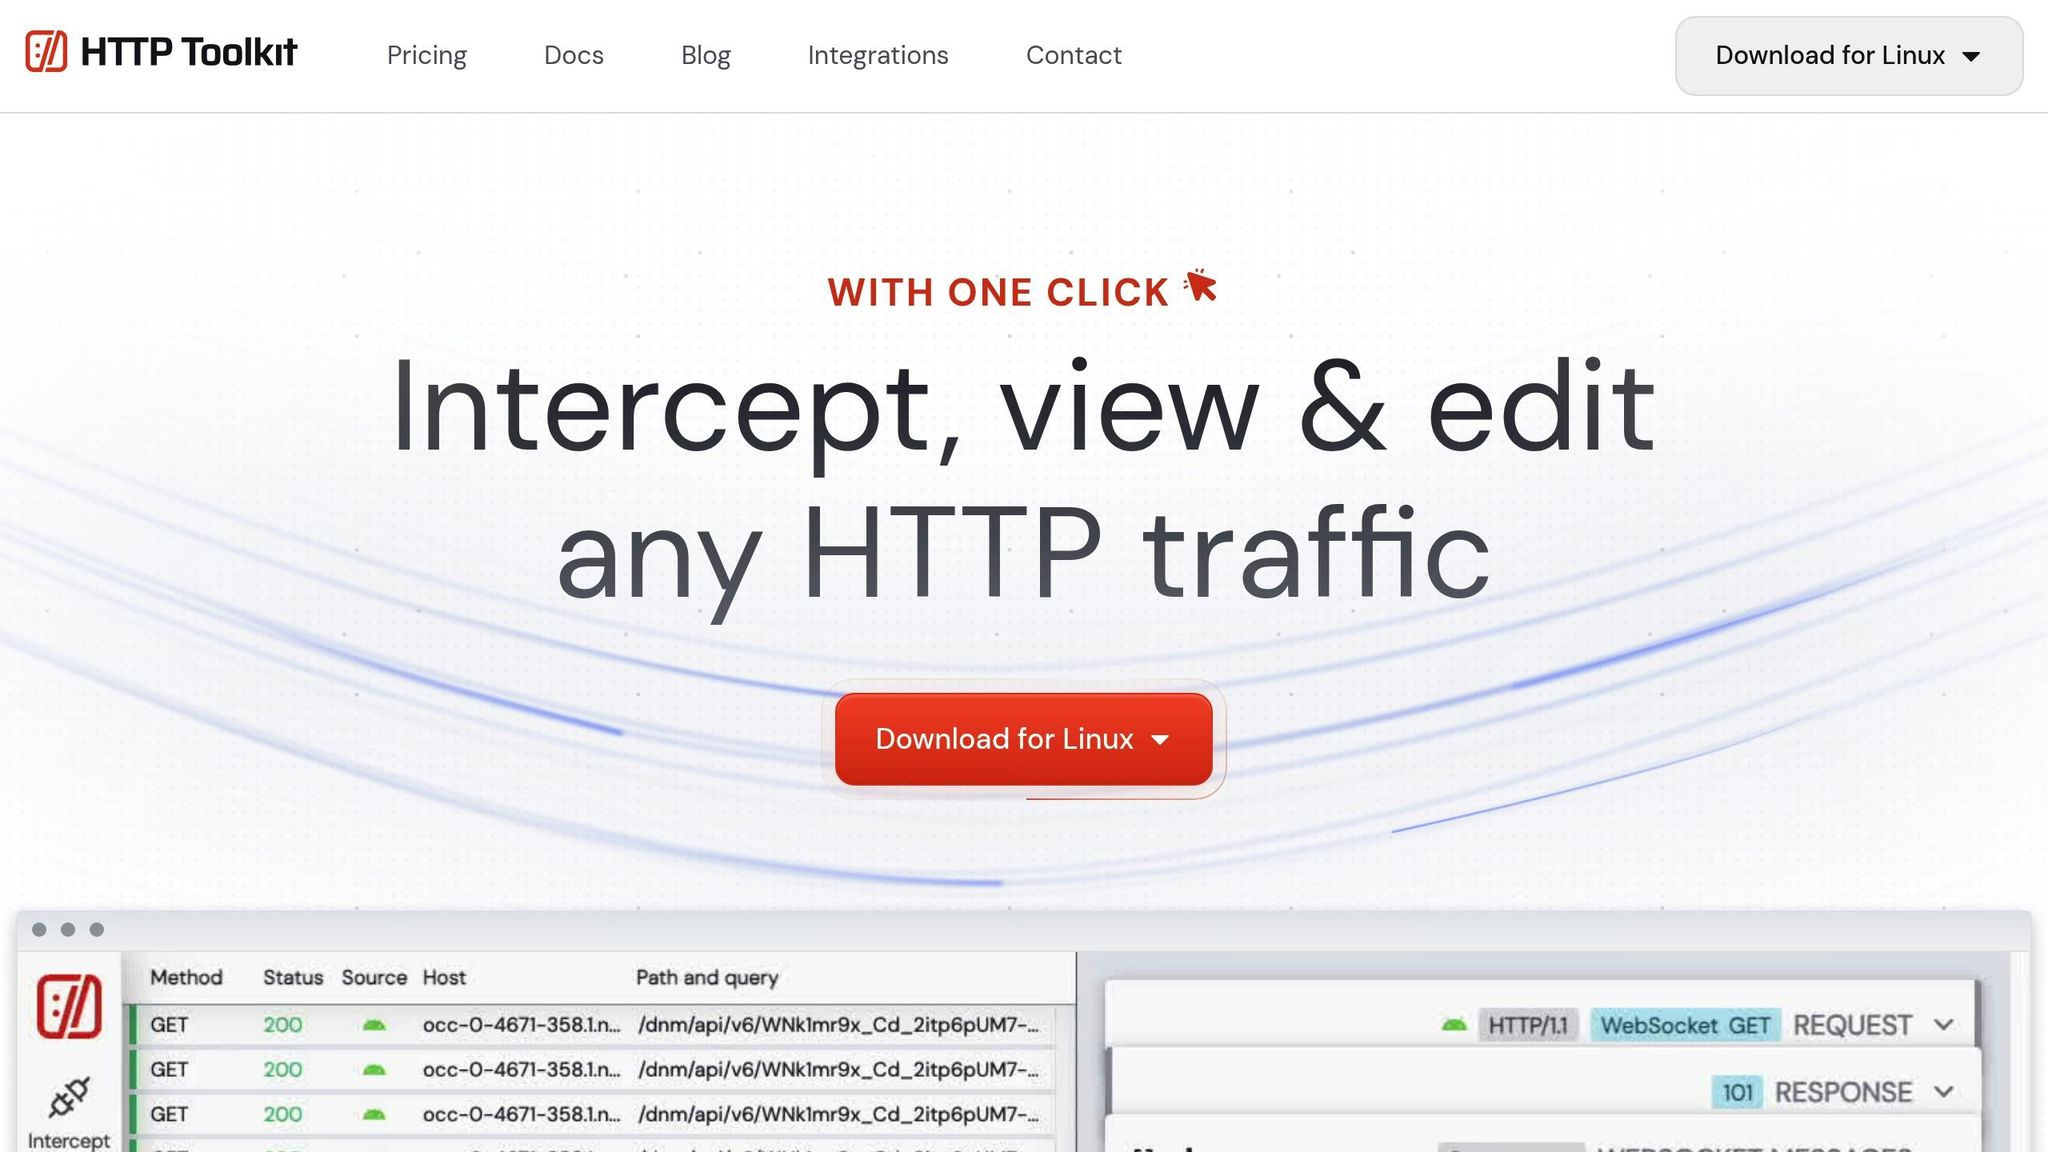
HTTP Toolkit is an open-source debugging tool that's gained the trust of over 1,000 developers and earned recognition on GitHub for its hassle-free, targeted interception features.
Traffic Monitoring and Debugging Capabilities
With HTTP Toolkit, you can automatically target specific clients and dive deep into traffic analysis. It offers powerful filtering options, autoformats data like JSON, Protobuf, Base64, HTML, XML, and JavaScript, and lets you pause live traffic at breakpoints for real-time edits. On top of that, you can send custom requests to test APIs and explore parameters - all using the same set of debugging tools. These features work seamlessly in modern protocol environments.
Support for Advanced Protocols (HTTP/2, WebSocket, etc.)
HTTP Toolkit is built to handle modern protocols like HTTP/2 and WebSockets. It can intercept plain HTTP, encrypted HTTPS, WebSocket data, HTTP/2 traffic, proxy requests, and direct requests, giving developers plenty of flexibility. For HTTP/2, it uses ALPN to automatically detect support, ensuring smooth handling of both HTTP/1 and HTTP/2 traffic. Its WebSocket debugging tools also make it easy to inspect data flowing in both directions.
Mocking and Request Manipulation Features
One standout feature of HTTP Toolkit is its ability to modify traffic on the fly. You can pause traffic at specific breakpoints and manually edit requests or responses, giving you fine-grained control over the HTTP lifecycle. This is especially handy for API testing and development.
Ease of Integration with macOS
For macOS users, HTTP Toolkit offers a smooth integration experience. Installation is quick and can be done via a .dmg file or Homebrew. Setting it up involves configuring HTTP proxy settings and installing a self-signed certificate to inspect HTTPS traffic. Developers often highlight its straightforward certificate setup and how easily it fits into macOS workflows.
5. Mitmproxy
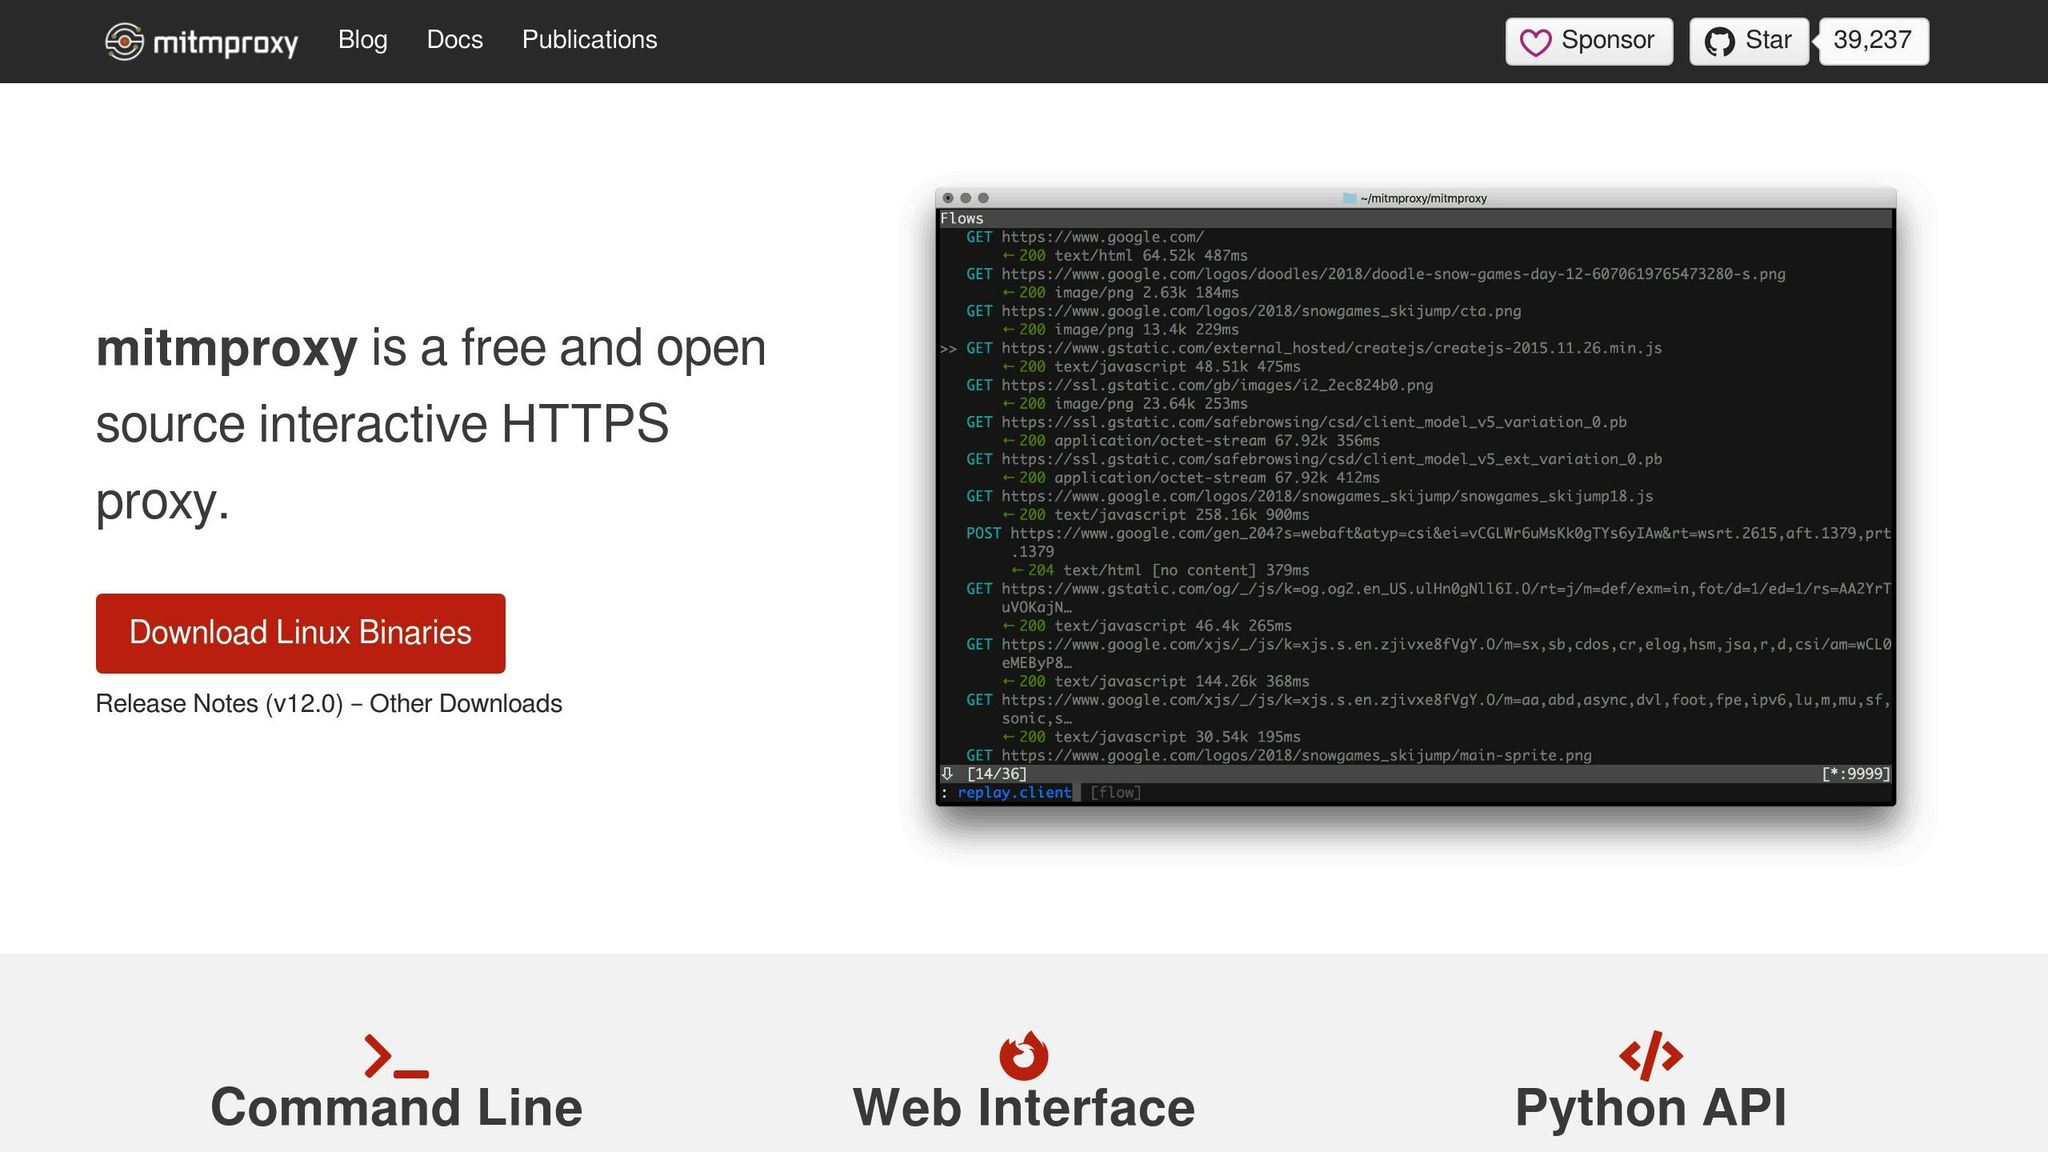
Mitmproxy is a free, open-source interactive HTTPS proxy that offers developers and security researchers a versatile tool for monitoring and debugging web traffic. What makes it stand out is its flexibility, with three distinct interfaces: an interactive console, a web-based GUI, and a command-line tool for scripting. This makes it adaptable to a variety of workflows.
Traffic Monitoring and Debugging Capabilities
Mitmproxy allows you to dive deep into HTTP and HTTPS traffic, inspecting requests and responses, including headers, query parameters, and body content. Its web interface, mitmweb, provides a user-friendly experience similar to Chrome's DevTools, making it easier to debug applications across platforms. This means you can capture and analyze HTTP traffic to identify issues like sluggish responses or oversized payloads.
One of its standout features is the ability to intercept and decrypt HTTPS traffic by dynamically generating SSL/TLS certificates. However, to avoid SSL warnings, you’ll need to install Mitmproxy’s CA certificate on your client devices. This capability is invaluable for spotting performance bottlenecks and ensuring sensitive data remains secure.
Support for Advanced Protocols (HTTP/2, WebSocket, etc.)
Mitmproxy handles modern web protocols with ease, supporting HTTP/1, HTTP/2, HTTP/3, WebSockets, and SSL/TLS-encrypted traffic. For HTTP/2, it automatically downgrades to HTTP/1 if the upstream server doesn’t support the newer protocol, ensuring smooth operation across different environments. Its WebSocket support, built using the wsproto project, even includes message compression, making it a robust choice for debugging real-time applications.
Mocking and Request Manipulation Features
One of Mitmproxy’s most exciting capabilities is its ability to intercept, modify, and replay web traffic. With its Python API, you can automate tasks and create custom add-ons to manipulate traffic in real time [35,38]. This means you can tweak headers, change request paths, block specific requests, or even simulate server responses to test error handling.
For instance, in January 2024, zen8labs demonstrated how Mitmproxy could modify API responses using a JSON configuration file. They showcased how to change movie titles in a JSON response and display the altered content in a movie app. Security researchers also appreciate Mitmproxy for its ability to tweak request parameters, helping them test how applications respond to unexpected or malicious inputs. This makes it an excellent tool for identifying vulnerabilities and mimicking potential attacks.
Ease of Integration with macOS
Setting up Mitmproxy on macOS is a breeze. Simply install it using Homebrew with this command: brew install mitmproxy. While it’s cross-platform and works on Windows and Linux as well, it integrates particularly well with macOS development workflows. Once installed, configure your browser or device to use Mitmproxy as a proxy and install its CA certificate.
You can launch its command-line interface by typing mitmproxy in the terminal, start the web interface with mitmweb (accessible at http://localhost:8081), or use mitmdump for scripting and automation. It also supports routing mobile device traffic through the proxy, making it a handy tool for debugging iOS and Android apps on macOS. Whether you're working on web or mobile development, Mitmproxy is a reliable companion for debugging and testing.
Tool Comparison Chart
Selecting the right HTTP debugging tool hinges on your specific workflow and platform preferences. Below is a detailed comparison of key features and capabilities:
| Tool | Platform Support | Key Strengths | Protocol Support | User Rating | Pricing Model |
|---|---|---|---|---|---|
| ReqRes | macOS (Native) | Real-time monitoring, one-click setup, local file mocking | HTTP(S) | – | $59.99 (Single), $69.99 (Two devices) |
| Charles Proxy | Windows, macOS, Linux | In-depth traffic analysis, SSL/HTTPS decryption | HTTP, HTTPS | – | Commercial license |
| Proxyman | macOS (Native) | Optimized for Apple Silicon, GraphQL debugging, scripting | HTTP(S) | 4.8/5 | Commercial license |
| HTTP Toolkit | Windows, Linux, macOS | Easy interception, breakpoint editing | HTTP(S) | – | Open-source/Commercial |
| Mitmproxy | Windows, Linux, macOS | Python scripting, extensive customization, open-source | HTTP with TLS support | – | Free (Open-source) |
Traffic Interception and Monitoring
Each tool offers unique capabilities for traffic interception and monitoring. ReqRes simplifies the process with one-click setup for immediate inspection, while HTTP Toolkit ensures a hassle-free interception experience. For more advanced needs, Mitmproxy stands out with its Python API, enabling automated tasks and custom add-ons for detailed traffic manipulation.
Request and Response Manipulation
Debugging often requires precise request and response modifications. Proxyman includes a JavaScript-based scripting tool for real-time traffic editing, while HTTP Toolkit offers intuitive breakpoint functionality for seamless request manipulation. Developers who prefer programmatic control will appreciate Mitmproxy's Python API, which allows extensive automation and customization.
Protocol Coverage
All the tools in this comparison support HTTP and HTTPS traffic, but their focus varies. ReqRes, Charles Proxy, Proxyman, and HTTP Toolkit excel at inspecting HTTP(S) requests and responses. Mitmproxy goes a step further by offering TLS decryption, making it ideal for secure traffic interception.
User Experience and Setup
Ease of use and system integration are critical factors. Native macOS tools like ReqRes and Proxyman shine with smooth system integration and user-friendly interfaces. ReqRes prioritizes native macOS optimization, while Mitmproxy's command-line interface may appeal to developers who prefer a lightweight, script-driven approach. However, this might feel less accessible for those who favor graphical interfaces.
Performance and Resource Usage
When it comes to performance, native apps like ReqRes and Proxyman lead with efficient resource usage and system optimization. HTTP Toolkit, despite being cross-platform, is known for its simple installation process and reliable performance across all supported operating systems.
Summary of Use Cases
- ReqRes and Proxyman: Best suited for macOS-focused workflows, offering native performance and advanced debugging tools.
- HTTP Toolkit: A great option for cross-platform compatibility with minimal setup requirements.
- Charles Proxy: Ideal for comprehensive traffic analysis and SSL/HTTPS decryption.
- Mitmproxy: Perfect for developers comfortable with command-line tools, offering powerful scripting and automation capabilities.
Conclusion
Selecting the right HTTP debugging tool ultimately boils down to your development workflow, technical needs, and platform preferences. With the global market for debugging tools expected to hit $1.75 billion by 2030, it's clear these tools are becoming indispensable in modern software development.
For developers working on macOS, ReqRes and Proxyman offer seamless integration and platform-specific optimization. If you're part of a cross-platform team, HTTP Toolkit stands out for its ease of setup and consistent performance across different operating systems. Meanwhile, Charles Proxy is a go-to solution for those needing detailed SSL/HTTPS decryption and traffic analysis. For developers who enjoy working directly in the terminal and leveraging Python scripting, Mitmproxy is a powerful option.
The key is to align your choice of debugging tool with your specific environment and the challenges you face most often. These tools not only help you identify and fix issues faster but also improve overall software quality and code reliability - saving time and effort in the long run.
FAQs
What should I look for in an HTTP debugging tool for macOS?
When choosing an HTTP debugging tool for macOS, it's crucial to focus on features that match your development needs. A good tool should allow you to capture and inspect HTTP(S) traffic in real-time, which is vital for troubleshooting network issues. Features like request modification, advanced filtering, and traffic simulation can make your workflow much more efficient.
An intuitive interface is another key factor - nobody wants to waste time wrestling with a complicated tool. Make sure the tool integrates smoothly with your existing setup and offers features like SSL inspection if your projects require it. Finally, weigh the cost against the specific features you need to ensure it’s the right fit for your work.
How do HTTP debugging tools handle advanced protocols like HTTP/2 and WebSocket?
Modern HTTP debugging tools are packed with features to handle advanced protocols like HTTP/2 and WebSocket, making them a go-to resource for developers building real-time or high-performance applications. These tools let you monitor, debug, and analyze HTTP/2 traffic, which is crucial for improving the speed and reducing the latency of modern web applications.
When it comes to WebSocket and Secure WebSocket (WSS) traffic, these tools are invaluable for inspecting real-time data exchanges, such as live chat systems or streaming services. That said, capturing WebSocket traffic from certain platforms - like iOS apps using URLSessionWebSocketTask - can require extra configuration due to system-level restrictions. Setting up these tools correctly ensures seamless debugging and helps you get the most out of their capabilities.
What are the advantages of using open-source tools for debugging the HTTP lifecycle?
Open-Source Tools for HTTP Lifecycle Debugging
When it comes to debugging the HTTP lifecycle, tools like HTTP Toolkit and Mitmproxy are game-changers for developers. These tools let you intercept, inspect, and even modify HTTP(S) requests and responses in real time. This capability is crucial for identifying API issues and ensuring your application runs smoothly during both development and testing.
The best part? Many of these tools are free, making them accessible whether you're part of a large team or working solo. They also come with features like automation and customization. For instance, Mitmproxy supports Python scripting, which can help you automate repetitive tasks and streamline your workflow. This level of flexibility makes these tools an essential part of any developer’s debugging toolkit.