
Useful API debugging techniques.
API debugging is key to fixing issues and improving software performance. Here’s a quick rundown of what you'll learn:
- Common Problems: Troubleshooting HTTPS traffic, understanding error codes (like 400 or 500), fixing cache issues, and validating data formats.
- Essential Tools: Use tools like Postman, Charles Proxy, Wireshark, and ReqRes to inspect traffic, test requests, and simulate network conditions.
- Key Techniques: Analyze HTTP(S) traffic, automate tests with scripts, simulate slow networks, and mock API responses to test edge cases without live servers.
- Practical Benefits: Debugging APIs effectively can reduce errors, boost performance, and even lead to measurable business results (e.g., increased revenue or reduced bounce rates).
Want to dive deeper? Keep reading for step-by-step guidance and tool recommendations.
HTTP(S) Traffic Analysis
Analyzing HTTP(S) traffic is essential for identifying API errors quickly. This process becomes more efficient with the help of specialized tools.
ReqRes Traffic Monitoring Setup
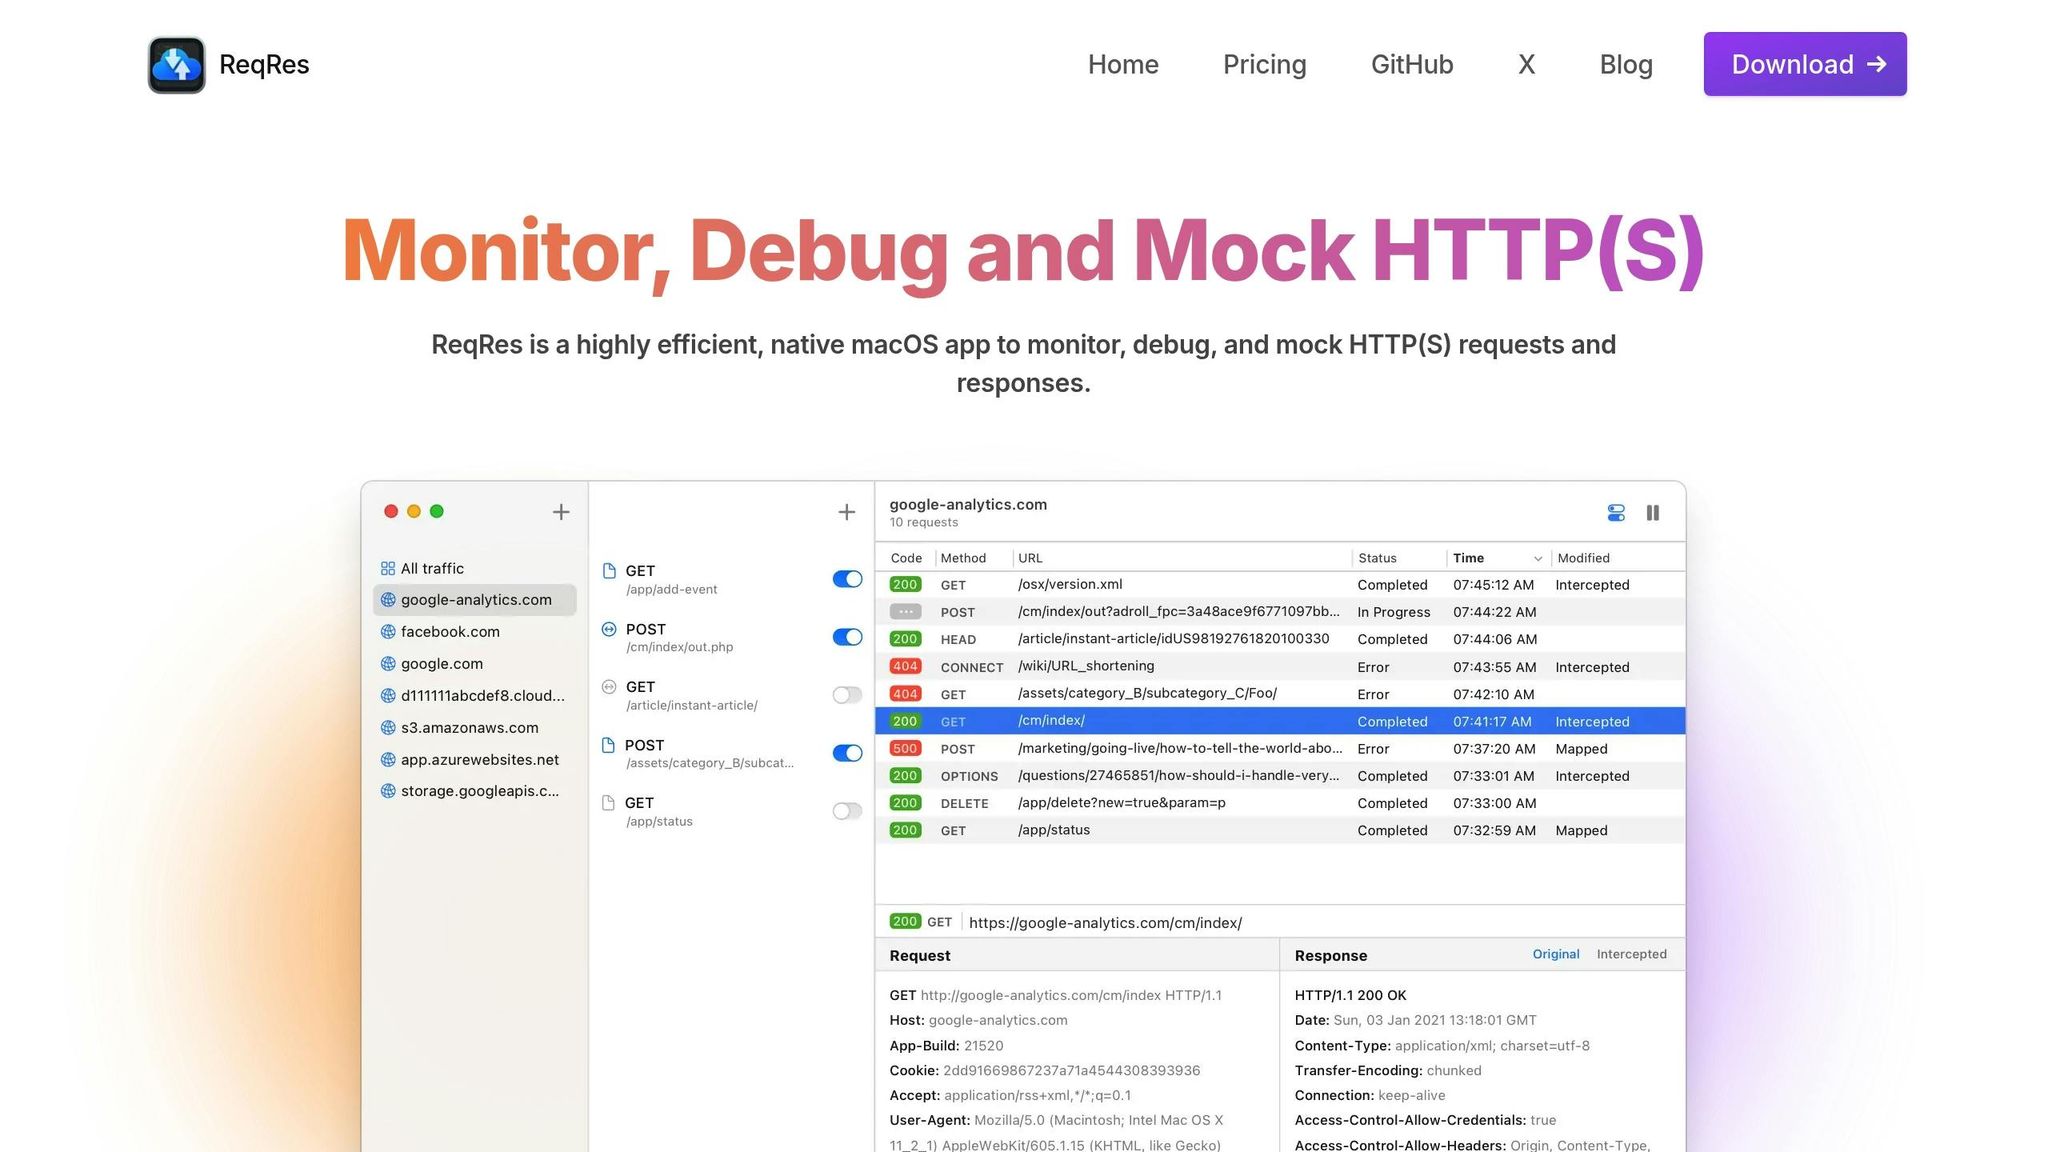
Start by downloading and launching ReqRes from the App Store. Then, configure your browser to route traffic through localhost:8080 by navigating to the 'Proxy' tab in the app.
| Feature | Function | Benefit |
|---|---|---|
| Real-time | Monitor live requests/responses | Spot issues immediately |
| HTTPS | Basic HTTPS MITM | Analyze secure traffic |
| Filtering | Apply custom filters | Focus on relevant traffic |
| Encoding | Base64, URL, HTML | Simplify data transformations |
For deeper HTTPS traffic analysis, consider using Charles Proxy alongside ReqRes.
HTTPS Inspection in Charles Proxy
Charles Proxy enhances HTTPS analysis by providing SSL proxying capabilities. Here's how to set it up:
- Install Charles Proxy and configure your system's proxy settings.
- Add the Charles Root Certificate to your system's keystore.
- Enable SSL Proxying for specific domains you need to inspect.
- Verify SSL inspection by confirming access to encrypted traffic.
This setup allows you to analyze secure API interactions in greater detail, complementing ReqRes's monitoring.
Network Analysis in Wireshark
For a more in-depth look at API traffic, Wireshark offers protocol-level analysis. It complements proxy-based tools by providing granular insights into network behavior.
-
Protocol Filtering
Apply display filters to focus on specific traffic types. For example:- To view HTTP traffic on a specific port:
http && tcp.port == <port>
- To view HTTP traffic on a specific port:
-
Stream Analysis
Use the HTTP stream view (CTRL+ALT+SHIFT+H) to examine complete request/response cycles. This includes both headers and body content, offering a full picture of API interactions. -
Authentication Analysis
Wireshark can capture and analyze JWT tokens directly from HTTP headers. This is particularly useful for troubleshooting authentication issues. Additionally, you can create custom columns to highlight specific protocol fields, making it easier to identify patterns in the traffic.
| Analysis Type | Filter Command | Purpose |
|---|---|---|
| HTTP Traffic | http && tcp.port == <port> |
Focus on web API traffic |
Request and Response Testing
Thorough request testing is essential for catching API issues early in the development process.
Postman Request Testing
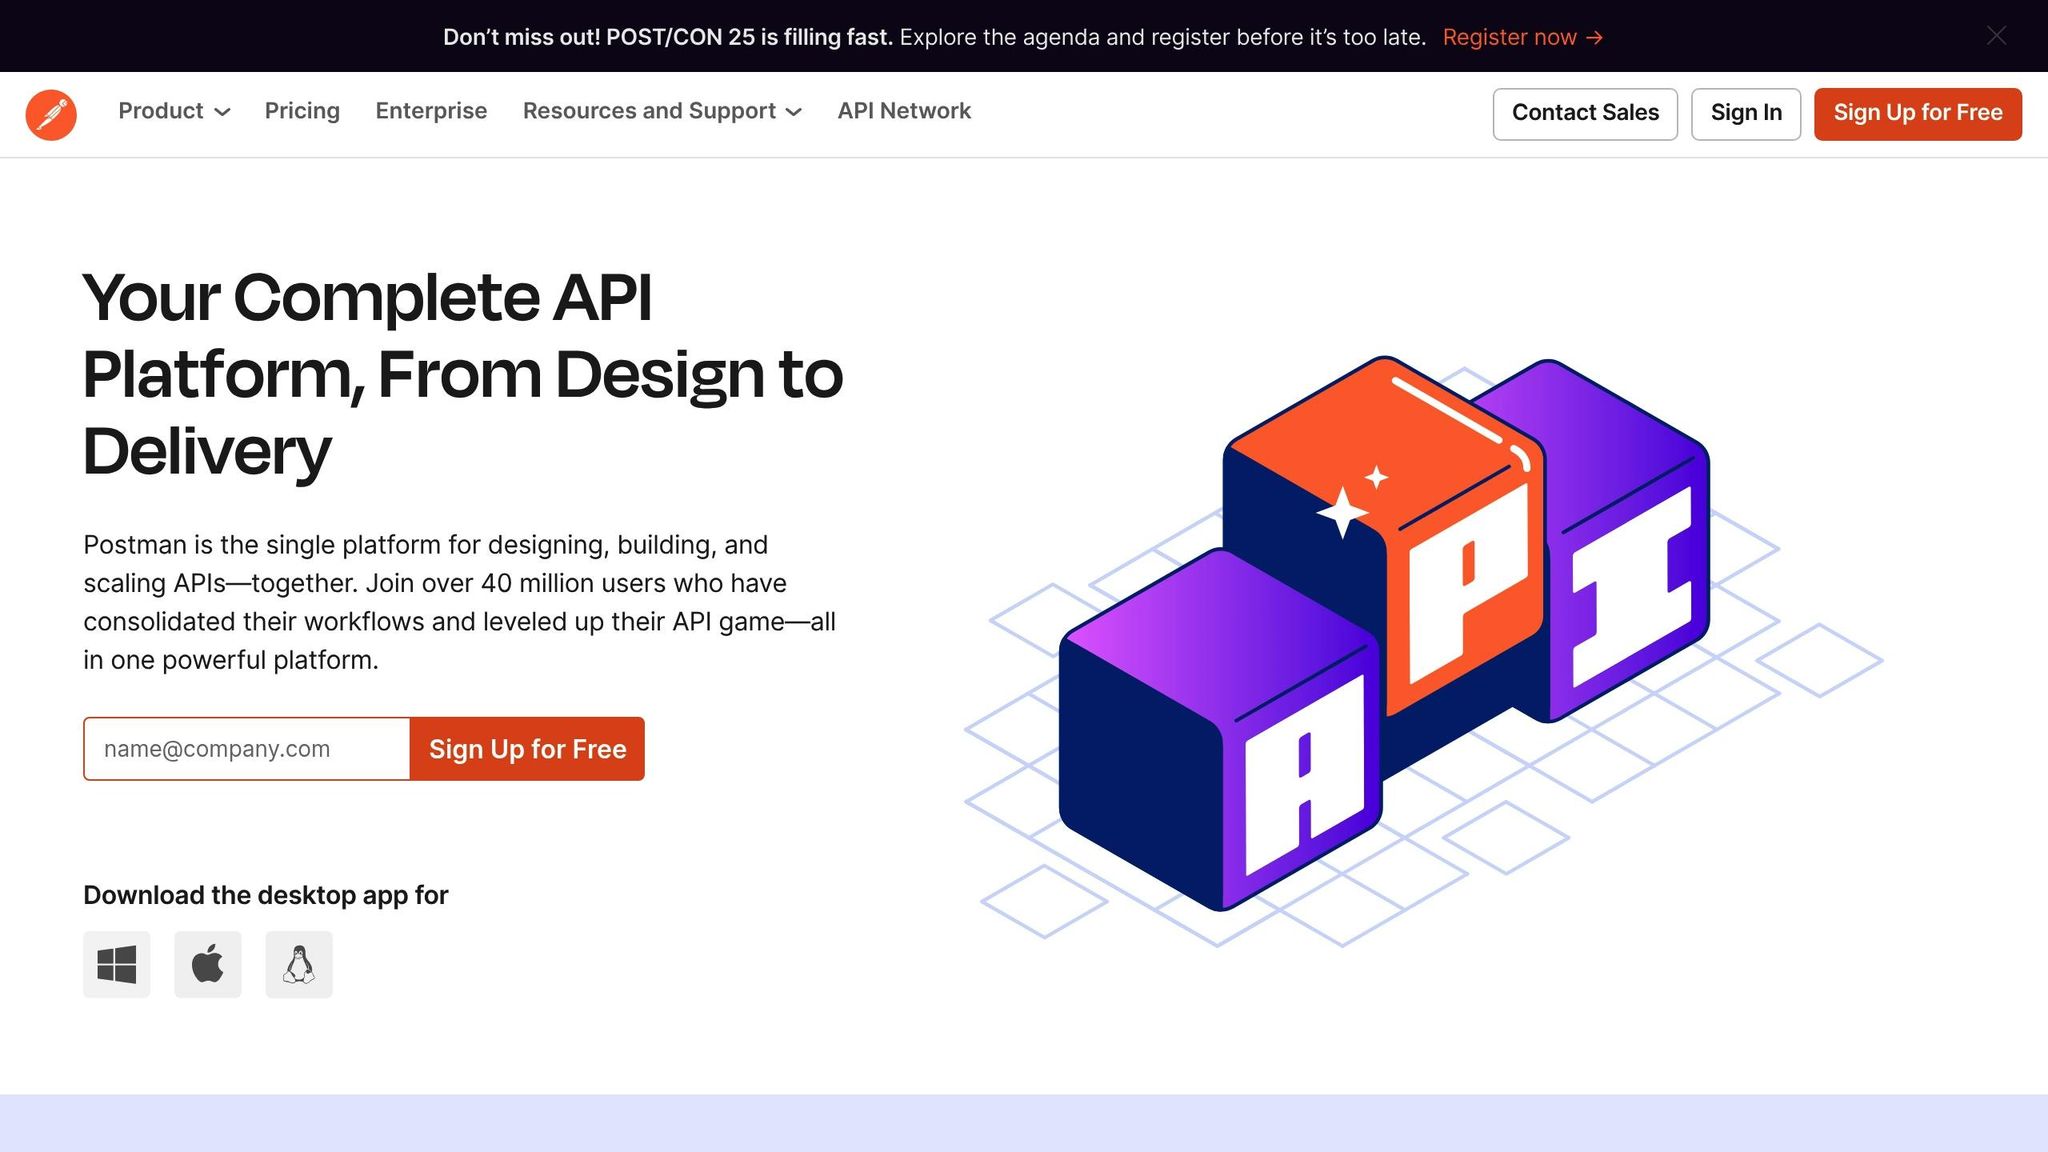
Postman makes API testing straightforward and efficient. Here's how you can use it for effective request testing:
-
Basic Request Testing
Start by creating a new request in Postman. Specify the API endpoint and HTTP method, then examine the response's status codes, headers, and body content to ensure everything is functioning as expected. -
Automated Test Scripts
Use JavaScript test scripts in Postman to validate responses automatically. For instance:
These scripts allow you to confirm status codes, data integrity, and more without manual checks.pm.test("Status code validation", () => { pm.response.to.have.status(200); }); pm.test("Data validation", () => { const jsonData = pm.response.json(); pm.expect(jsonData.name).to.eql("London"); }); -
Collection-based Testing
Organize related requests into collections to test multiple scenarios efficiently. Collections enable automated testing across a series of API calls, helping you identify issues in interconnected workflows.
| Test Type | Purpose | Key Validation Points |
|---|---|---|
| Status Codes | Ensure proper response codes | 200s for success, 400s for errors |
| Data Format | Validate JSON structure | Data types, required fields |
| Business Logic | Check application-specific rules | Value ranges, inter-field relationships |
Pair these tests with ReqRes's debugging tools for enhanced API testing on macOS.
ReqRes Request Controls
ReqRes is a powerful tool for debugging API calls on macOS, offering real-time insights by intercepting HTTP(S) requests and responses.
Key features include:
- Intercepting and examining requests before they reach the server
- Viewing formatted JSON or XML responses, along with headers and status codes
- Tracking request and response timing to identify performance bottlenecks
Common HTTP Status Codes to Monitor:
- 400 Bad Request: Indicates missing or invalid parameters - double-check the API request.
- 401 Unauthorized: Ensure authentication credentials are accurate.
- 403 Forbidden: Review user permissions or access restrictions.
- 429 Too Many Requests: Pay attention to rate limiting and adjust as needed.
These tools and techniques together ensure a solid foundation for API functionality and performance.
Network Condition Tests
Testing APIs under different network conditions is essential to ensure they perform reliably, regardless of connection speed or quality. Below, we explore some key tools available on macOS for simulating these scenarios.
ReqRes Network Settings
ReqRes is a handy tool for monitoring API responses, particularly when combined with macOS tools that simulate network conditions. It helps you track response times and identify bottlenecks across various connection speeds.
If you need more advanced throttling options, Charles Proxy is a great alternative.
Charles Proxy Speed Settings
Charles Proxy offers robust throttling features, enabling you to mimic a variety of connection speeds and latency scenarios. Here's a quick overview of its preset settings:
| Throttle Setting | Download Speed | Upload Speed | Latency |
|---|---|---|---|
| 3G Network | 750 Kbps | 250 Kbps | 200ms |
| DSL | 2 Mbps | 512 Kbps | 50ms |
| Cable Modem | 5 Mbps | 1 Mbps | 28ms |
To configure throttling in Charles Proxy:
- Go to Proxy > Throttle Settings.
- Enable throttling, then choose a preset or create custom settings.
- Start throttling from the Proxy menu.
For a more comprehensive setup, you can pair Charles Proxy with macOS' built-in network simulation tools.
macOS Network Testing Tools
Apple's Network Link Conditioner is another powerful option for simulating network conditions. It’s part of the Hardware I/O Tools package available through Apple's developer resources. Here's how to get started:
-
Installation and Setup
Download the Hardware I/O Tools package from the Apple Developer Downloads page. Once installed, you can access Network Link Conditioner in System Preferences. -
Built-in Profiles
The tool includes several preset profiles to simulate common connection types, such as:- LTE
- 3G
- Cable Modem
- DSL
- Edge
- WiFi
-
Custom Profile Creation
If the default profiles don’t meet your needs, you can create custom profiles by adjusting parameters like downlink and uplink bandwidth, packet loss percentage, and response delay.
Using these tools together ensures your APIs are ready to handle a variety of network conditions, from high-speed WiFi to slower, more constrained connections.
API Response Mocking
API response mocking is a way to simulate API behaviors for testing purposes, removing the need for live servers. This approach helps developers test various scenarios in a controlled environment.
Postman Mock Response Setup
To set up mock responses in Postman, follow these steps:
-
Create and Save Your Request
- Build your API request within a Postman collection.
- Add the necessary headers and parameters.
- Save the request for future use.
-
Configure Mock Examples
- Send the request and save the response as an example.
- Create additional examples to represent different scenarios, such as successful responses, errors, or timeouts.
Postman also lets you tweak mock server settings. For example, you can introduce delays to simulate network latency or configure specific status codes to test how your application handles errors.
"In March 2023, the Postman team introduced enhanced mock server capabilities, enabling developers at Atlassian to simulate complex API interactions for their Jira Cloud platform. By creating detailed mock responses that mirrored various error conditions and edge cases, Atlassian's QA team was able to identify and resolve 35 critical bugs related to authentication and data handling before the platform's major update in June 2023. This proactive approach reduced post-release incidents by 42% and saved an estimated 200 engineering hours in debugging time."
Similarly, ReqRes offers a straightforward way to simulate API responses locally, streamlining the testing process.
ReqRes Local Response Files
ReqRes allows you to use local files as API responses, making it an excellent tool for quick development and testing. Using the Map Local Tool, you can:
- Serve local files as API responses.
- Define custom rules to match specific responses.
- Update test data instantly without deploying to a server.
- Test edge cases efficiently.
Why Use ReqRes Local Response Files?
- You can update responses immediately by modifying local files.
- It eliminates the need for server deployments during testing.
- It ensures a consistent testing environment for the entire team.
- It allows you to simulate complex scenarios directly on your local machine.
Here’s an example folder structure for mock responses:
mock-responses/
  ├── success/
  │   ├── users.json
  │   └── products.json
  ├── errors/
  │   ├── 404.json
  │   └── 500.json
  └── validation/
      └── invalid-input.json
The Map Local Tool makes development faster by letting you switch between different response scenarios without needing to modify application code or wait for server updates.
Conclusion
After diving into the specifics of debugging methods, let’s revisit the main strategies and see how ReqRes simplifies the process for developers.
Key Takeaways
Effective API debugging requires a structured approach to identify and fix problems efficiently. By focusing on HTTP(S) traffic, testing requests and responses, and leveraging mock responses, developers can tackle issues head-on. Here’s a quick recap of the techniques we covered:
- Monitoring HTTP(S) traffic in real-time
- Testing API requests and responses in various scenarios
- Simulating different network conditions
- Using mock responses to test APIs effectively
How ReqRes Enhances Debugging
ReqRes makes API debugging seamless for macOS users with its intuitive design and powerful tools. One standout feature is the Map Local Tool, which provides several benefits:
| Feature | What It Does |
|---|---|
| Real-time Monitoring | Offers instant traffic insights |
| Local Response Files | Enables quick and easy testing |
| Network Simulation | Tests APIs under varying conditions |
| Traffic Interception | Allows detailed request inspection |
FAQs
How can I use ReqRes with Charles Proxy to analyze HTTPS traffic effectively?
To dive into analyzing HTTPS traffic using ReqRes and Charles Proxy, the first step is setting up Charles Proxy to intercept and decrypt HTTPS requests. This involves ensuring your system recognizes and trusts the Charles Proxy SSL certificate, allowing you to capture secure traffic without any issues. Once everything is configured, Charles Proxy becomes a powerful tool for monitoring and inspecting API requests and responses in real time.
On the other hand, ReqRes allows you to simulate API responses, making it easier to test various scenarios. By pairing it with Charles Proxy, you can observe how these simulated requests behave under different conditions - like slow network speeds or error states. This combination of tools offers a practical way to debug and fine-tune your APIs, giving you a clearer picture of their performance and behavior.
What are the benefits of using mock API responses for testing, and how does ReqRes make this easier?
Using mock API responses during testing brings a lot to the table. It lets developers mimic real API behavior without depending on live servers, making testing faster and more predictable. This is especially handy when tackling edge cases, managing errors, or developing features while the actual API is still a work in progress.
ReqRes makes this process a breeze by offering a dependable platform for creating and managing mock API responses. With it, developers can easily set up mock endpoints to simulate different scenarios, ensuring their applications respond correctly to various API behaviors. This streamlines debugging and saves valuable time by reducing reliance on external systems.
How can simulating network conditions with tools like Charles Proxy or macOS Network Link Conditioner improve API debugging?
Simulating network conditions with tools like Charles Proxy or macOS Network Link Conditioner gives developers the ability to recreate scenarios like high latency, packet loss, or sluggish connection speeds. This approach is crucial for understanding how APIs behave when the network isn't performing at its best and ensures they can handle these challenges smoothly.
By replicating these network hurdles, developers can:
- Spot and resolve API issues that might only surface in specific environments.
- Analyze requests and responses to confirm they manage delays or disruptions effectively.
- Evaluate API stability across varied conditions, fine-tuning performance for users.
These simulations play a key role in building APIs that remain dependable and efficient, even when network conditions are far from ideal.